
The Go4 Analysis Framework
Introduction V4.6
J.Adamczewski-Musch,
M.Al-Turany, D.Bertini, H.G.Essel, S.Linev
27 November 2013
Content
The
Go4 Analysis Framework Introduction V4.6
2.1.1 Go4 tasks with all
communications
2.1.3 Other analysis functions
3.2 Event classes, interface to MBS
3.5 Analysis base class TGo4Analysis
3.5.1 User subclass of TGo4Analysis
3.6.1 The go4analysis main program
3.6.2 Command line mode (batch)
3.6.3 Creating the user analysis
3.6.5 Analysis controlled by Go4 GUI
3.6.6 Analysis as server for multiple
Go4 GUIs
3.6.7 Configuration of analysis
3.6.8 Support of older analysis code
3.6.10 Start-up of GUI controlled analysis
3.6.11 Submit settings and run analysis
3.6.12 Shutdown of the analysis client
3.6.13 Disconnect or shutdown analysis
server
4.4 Simple example with one step
4.4.3 Auto-save file mechanism
4.5.4 Auto-save file mechanism
4.6.3 Steering methods in processor
function BuildEvent
4.7 Example with some advanced
tecniques
4.8 Example of analysis with a user
defined event source
5.1.1 File, Tools, Analysis menus
5.3.1 Launch analysis task in client
mode
5.3.2 Launch analysis task in server
mode
5.3.3 Connect to existing analysis
server
5.4.2 Analysis terminal window
5.4.3 Macro execution in the analysis
5.4.4 Auto-save file mechanism
5.4.6 User defined event sources
5.5.3 Analysis folder controls
5.5.7 Resetting and deleting objects
5.5.8 Histogram server connection
5.6.2 Remote mode (dynamic list
histogram)
5.6.3 Creating a new histogram
5.7.6 Draw options and axis scaling
5.7.7 Channel and window markers
5.8.1 Conditions editing in viewpanel
marker editor
5.8.4 Conditions bound to pictures
5.11.3 Parameters containing fitters
5.13 Histogram/condition information
6 Analysis Server for ROOT macros
6.1 Methods for object registration
6.2 Methods for run control and
execution
7 Control of remote Go4 analysis from
a ROOT session
7.3 Controlling the analysis by
command
8 Go4 analysis with DABC based
webserver
8.1 Startup of go4analysis with
webserver
8.2 Viewing analysis objects with web
browser
9 The Go4 Composite Event Classes
9.2 Application Programmers Interface
11 Table of Menu and Toolbar
Keyboard Shortcuts
13.1 New features in Go4 v4.6 (November
13)
13.2 New
features in Go4 v4.5 (July 11)
13.3 New
features in Go4 v4.4 (November
09)
13.4 New
features in Go4 v4.3 (June 09)
13.5 New
features in Go4 v4.2 (April
09)
13.6 New
features in Go4 v4.1 (October
08)
13.7 New
features in Go4 v4.0 (February
08)
13.8 New
features in Go4 v3.3 (May 07)
13.9 New features in Go4 v3.2 (July 06)
13.10 New features in Go4 v3.1 (May 06)
13.11 New features in Go4 v3.0
(November 05)
13.12 New features in Go4 v2.10 (June
05)
13.13 New features in Go4 v2.9
(February 05)
13.14 New features in Go4 v2.8
(September 04)
13.15 New features in Go4 v2.7 (June
04)
13.16 New features in Go4 v2.6 (May 04)
13.17 New features in Go4 v2.5
(December 03)
13.18 New features in Go4 v2.4 (August
03)
13.19 New features in Go4 v2.3 (May 03)
13.20 New features in Go4 v2.2 (April
03)
1 Editorial
Layout used in this document:
Text Times New Roman, 10 pt
Verbatim text Courier new 9
pt
Menu items Arial bold 9 pt
Class names Arial
italics , 9 pt
Methods () Arial italics , 9 pt
Go4 screenshots
QT4 Style CDE, Font Arial 10pt
Icons
in text must be cut from bottom and diminuished to be in line.
Einfügen->Referenz->Querverweis:
Überschrift+Überschriftnummer/Seitenzahl
Einfügen->Referenz->Index
und Verzeichnisse: Eintrag festlegen, Indexeintrag+Aktuelle Seite. (search for Feld)
Index entries can be edited in text (first:second)
Index
aktualisieren (RMB)
Inhaltsverzeichnis
aktualisieren (RMB)
2 Introduction
The Go4 (GSI Object Oriented On-line-Offline) Analysis Framework has been developed at GSI. It is based on the ROOT system of CERN. Therefore all functionality of ROOT can be used.
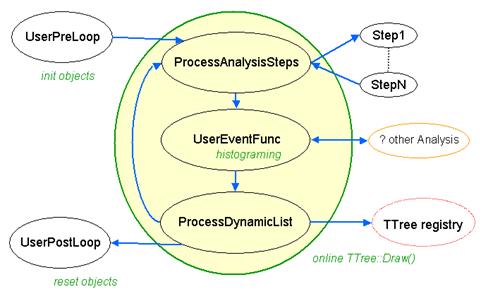
2.1.1 Go4 tasks with all communications
Go4 has two parts: the analysis framework itself and a Qt based GUI. Both can be used independently, or together. The separation of the analysis and GUI in two tasks is especially useful for on-line monitoring. The analysis runs asynchronously to the GUI which is (almost) never blocked. The same analysis can be run in batch/interactive mode or in remote GUI controlled mode. The GUI can be used stand alone as ROOT file browser and as histogram viewer for GSI standard histogram servers like MBS. Moreover, the analysis task can be run either as a client bound to one GUI (default), or can be started as an analysis server with the possibility to connect several GUIs (one controller and arbitrary number of observers with restricted commands).
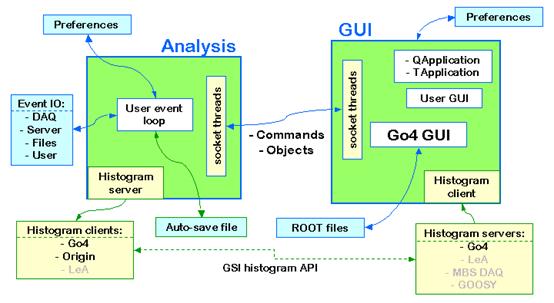
gui150
2.1.2 Go4 analysis steps
The Go4
framework handles event structures, event processing, and event IO. The
analysis event loop is organized in steps: 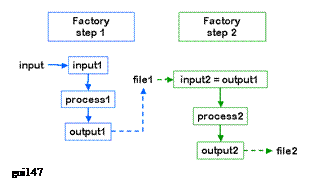 Each step has an input event, an output event, and an
event processor. The output event calls the event processor to be
filled. The event processor has also access to the input event. In the current
design the analysis is data driven. A first event object (input1) is filled
from some event source (input). An output event object (output1) is filled by
an event processor object (process1) which has access to both, input1 and output1.
Optionally the output event may be written to a file (file1). In the next step
the input event object (input2) can be either the output event object (output1)
from the previous step or retrieved from the file. The second output event
object (output2) is filled by the second event processor object (process2) and
can be optionally written to a second file.
Each step has an input event, an output event, and an
event processor. The output event calls the event processor to be
filled. The event processor has also access to the input event. In the current
design the analysis is data driven. A first event object (input1) is filled
from some event source (input). An output event object (output1) is filled by
an event processor object (process1) which has access to both, input1 and output1.
Optionally the output event may be written to a file (file1). In the next step
the input event object (input2) can be either the output event object (output1)
from the previous step or retrieved from the file. The second output event
object (output2) is filled by the second event processor object (process2) and
can be optionally written to a second file.
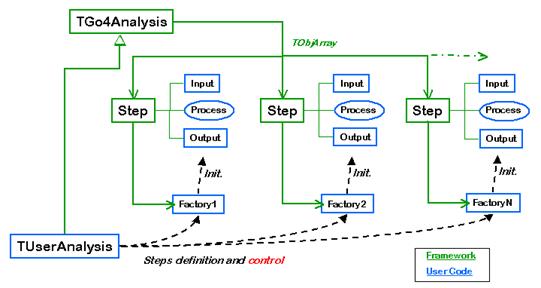
The information needed to create the event and processor objects (which are deleted when the event loop terminates) is stored in step factories which are kept in the analysis.
The processor and output event classes have to be provided by the user. The input classes for standard GSI event sources are provided by Go4 (see chapter 3, page 10). Analysis and step factory classes are provided by Go4 or can be implemented by the user as subclasses.
gui148
For normal operation, the Go4 analysis steps are designed to run subsequently. But in addition, each analysis step has access to the output events of all other previous analysis steps, so it would be possible to let analysis steps logically run “in parallel”, all starting with the output event of the first step, and all delivering their results to the last step that may collect and combine them.
gui149
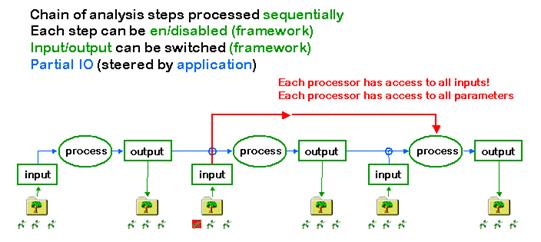
2.1.3 Other analysis functions
Outside the analysis steps the user functions UserPreLoop(), UserPostLoop(), and UserEventFunc() located in the user analysis class are executed as shown in the figure. In principle, they could be used to implement the full analysis without using the step mechanism. But for setting up a new analysis the use of steps is strongly recommended, because steps can be controlled by the GUI and offer event and IO management.
In the event loop, after processing the steps and UserEventFunc() the Go4 dynamic list processor is executed. This processor can be dynamically configured from the GUI to check conditions and/or fill histograms.
gui146
3 Go4 Analysis
The Go4 concept consists of base classes (interfaces) for event structures, algorithms, and IO, which can be implemented by user subclasses or by framework plug-ins (general service classes) delivered with Go4. Class descriptions and reference guides are available on the Go4 Website http://go4.gsi.de.
3.1 Event base classes
The interface classes provided by Go4 (a detailed description is in the reference manual) are normally not seen by the user. Starting with the examples (see chapter 4, page 21) one can better study derived working classes.
TGo4EventElement: Defines the event structure and methods to clear this structure.
Input and output event structures of each step of the analysis are instantiated
once at initialization. In the event loop event first cleared (via Clear() method
call) and than filled by the source class, where BuildEvent function is defined.
TGo4EventSource:
The source of the event data. This can be e.g. a file of a certain format, or a
socket connection to an event server. The event source class has a BuildEvent(TGo4EventElement*) method, which fills
event structures. In addition, CheckEventClass(TClass*) method can be implemented to check event class during
initialization. The class constructor should open (connect) the source; the
destructor should close (disconnect) it properly.
TGo4EventStore:
An object responsible for storing the event data. This can be e.g. a local file
of a certain format, but may as well be a connection to some storage device.
The virtual method Store(TGo4EventElement*) is used to store the pointed event object. The class constructor
should open the storage; the destructor should close it properly.
TGo4EventProcessor: An object that contains the algorithm to convert an input event object into an output event object (both of class TGo4EventElement). This is a subclass of TGo4EventSource, since it delivers the filling of the output event from the input event. The event processor implementation has to “know” the input and output event classes. Actual code of converting the data (i.e. actually performing the analysis) should be implemented in BuildEvent method.
TGo4EventFactory:
Defines the actual implementations of all the above. Go4 uses a factory design
pattern to create all event class objects at initialization. The virtual
methods:
CreateInputEvent(), CreateOutputEvent(),
CreateEventSource(TGo4EventSourceParameter*), CreateEventStore(TGo4EventStoreParameter*),
CreateEventProcessor(TGo4EventProcessorParameter*) have to be defined in the user factory. They create the
respective objects and return the pointer to it. The default factory provides
methods
DefEventSource(classname), DefEventProcessor(objectname,
classname), DefInputEvent(objectname, classname) and DefOutputEvent(objectname,classname).
Simple examples of a running Go4 analysis can be found on
directories $GO4SYS/Go4ExampleSimple, $GO4SYS/Go4Example1Step, and
$GO4SYS/Go4Example2Step.
3.2 Event classes, interface to MBS
Go4 offers predefined implementations of the event base classes, including an interface to the GSI data acquisition Multi Branch System MBS, the GSI list-mode files, and ROOT files.
TGo4EventElement (base
class):
TGo4MbsEvent MBS event format 10-1
TGo4MbsSubEvent MBS
subevent format 10-1
TGo4CompositeEvent Base class for all composite event structures
TGo4ClonesElement Clonesarray container for composite event
TGo4EventSource (base class):
TGo4MbsFile (read
from *.lmd list-mode file with format 10,1)
TGo4MbsEventServer (connect to MBS event server)
TGo4MbsStream (connect to MBS stream server)
TGo4MbsTransport (connect to MBS transport server)
TGo4RevServ (connect to remote event server)
TGo4FileSource (read from *.root file from Go4 tree, i.e. one
file containing one TTree per analysis step)
TGo4EventStore (base
class):
TGo4FileStore (write to *.root file with Go4 tree, this file
can be used as TGo4FileSource later)
TGo4BackStore Use
TTree existing only in memory to view and analyze
event structures.
These classes can be used directly to write simple
analysis.
3.2.1 A simple event loop
Using these
implementations, getting MBS event data into ROOT (without Go4 framework) could
look like this:
#include "Go4EventServer/Go4EventServer.h"
#include "Go4Event/TGo4EventEndException.h"
int main() {
TGo4EventSource* input = new TGo4MbsFile("file.lmd"); // MBS list-mode file
// TGo4EventSource* input= new TGo4MbsTransport("node"); // MBS transport server
// TGo4EventSource* input= new TGo4MbsStream("node"); // MBS stream server
// TGo4EventSource* input= new TGo4MbsEventServer("node"); // MBS event server
// TGo4EventSource* input= new TGo4RevServ("node"); // Remote event server
TGo4EventStore* output = new TGo4FileStore("output",1,5); // split level, compression
TGo4MbsEvent* event = new TGo4MbsEvent();
event->SetEventSource(input);
event->Init();
Int_t eof = 0, numEvents = 0;
while(eof==0) {
try{
event->Fill(); // read event
numEvents++; // eof throws exception
output->Store(event); // write to file
}
catch(TGo4EventEndException& ex) { eof=1; } // mark end of file
catch(...) { cout << "Error" << endl; eof=2; } // any other error
}
cout << "EOF after " << numEvents << " events" << endl;
}
The events in the ROOT
file can be retrieved by program, but not in tree viewers. For the use of tree
viewers, a new output event object should be filled and stored.
3.3 Analysis step classes
As mentioned above a Go4 analysis is organized in steps. The information needed to instantiate a step is kept in the step factory.
TGo4EventServerFactory (base class): (contains
factory methods that already know the above implementations. User step
factories must inherit from this class!)
TGo4StepFactory This
TGo4EventServerFactory can be used in most cases as user factory to
set up the analysis steps (example 1Step).
TGo4AnalysisStep objects of this class hold the definition of an analysis step.
Each analysis step has at least an input event object, an output event object and an event processor object. Additionally, it can have an event source (e.g. TGo4FileSource) and an event store (TGo4FileStore) instance. An analysis step is set up by a TGo4EventServerFactory subclass, i.e. TGo4StepFactory or a user defined subclass.
3.4 Object management
3.4.1 Go4 objects
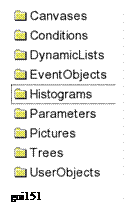 Objects used in Go4 are organized in ROOT folders. The folder
structure is sent to the GUI. Objects must be registered in the analysis to be
seen in the GUI browser. Registered objects can be located in the processors.
The top folders as seen in the GUI are shown on the left side. The methods to
register/locate objects are (pointer to the appropriate object, optional
subfolder as string, name including subfolder as string):
Objects used in Go4 are organized in ROOT folders. The folder
structure is sent to the GUI. Objects must be registered in the analysis to be
seen in the GUI browser. Registered objects can be located in the processors.
The top folders as seen in the GUI are shown on the left side. The methods to
register/locate objects are (pointer to the appropriate object, optional
subfolder as string, name including subfolder as string):
·
AddHistogram(pointer,subfolder), GetHistogram(name)
·
AddAnalysisCondition(pointer,subfolder), GetAnalysisCondition(name)
·
AddParameter(pointer,subfolder), GetParameter(name)
·
AddPicture(pointer,subfolder), GetPicture(name)
These methods are available in TGo4Analysis and TGo4EventProcessor subclasses. Objects created in a TGo4Analysis subclass can be located in all event processors. Objects created in event processors can be located in all subsequent event processors (steps).
Registered objects are stored/retrieved to/from the auto-save file, if enabled. Retrieval is done after creation of the analysis singleton before the creation of the steps. When an object retrieved from the auto-save file is created in a processor the retrieved object is replaced (stored data lost). When an object is created in the analysis singleton it will be replaced by the one retrieved from the auto-save file except histograms which are not retrieved in this case. This means that histograms created in the analysis singleton are always empty after startup.
3.4.2 Go4 parameters
Parameters used in the analysis are implemented by the user in classes derived from TGo4Parameter. Such objects are registered to the framework and can be edited by a generic parameter editor (see chapter 5.11.2, page 68). Parameter objects can be created in the user analysis or the event processor class. Parameter objects are loaded from an optional auto-save file after instantiation of the analysis and before instantiation of the processor objects. When created in the analysis the values set in the constructor are therefore overwritten by auto-save. To use the GUI editor, the UpdateFrom() method must be implemented to update the local (active) parameter object from the modified one delivered by the editor. In this method it is up to the user to ignore certain members or to execute whatever he wants. E.g. one could use parameters to execute commands. Parameters in the auto-save file can be edited. In the editor they can be saved/retrieved to/from files. Several mechanisms can be implemented to handle the parameter member values. The main question is how restricted the methods of modification should be.
1. Modify values only in the class constructor, then recompile. To prohibit changes by editor, the UpdateFrom() method could be just a no-op to avoid undocumented changes. The parameter object should be created and registered in the processor constructor (after possible auto-save restore). Pro: the parameter values are always strictly defined as coded. Con: the parameter values cannot be changed easily.
2. Modify values by editor, use auto-save to store. Create parameter object in analysis constructor. Auto-save must be enabled. Pro: parameter can modified by editor (UpdateFrom() method must be implemented) and changes will be restored from auto-save. Con: when the auto-save file must be deleted for some reasons. the latest values are lost.
3.
Use a macro to set values. This
macro must be executed in the processor constructor (after auto-save restore). UpdateFrom() could just execute
the macro to avoid undocumented changes. Pro: values are kept in a text file
and can be modified without recompile. Con: parameter cannot be changed by GUI
editor.
4.
Best combination: one can
use macro saveparam.C([file],wildcard,prefix) from $GO4SYS/macros creating macros
(one per parameter) to set all parameters to their current values,. The names
are built from prefix and parameter name. The macro can be executed in CINT
(then the parameters are taken from a file), or in the GUI or in the analysis.
The parameter is created in the analysis. Values are set from macro in processor
constructor. By this method parameter values can be edited by GUI, or macro can
be edited. Last version will be used independently of auto-save.
Example:
root[0].x
saveparam.C("myfile.root","*","setpar")
would produce macros setpar_par1.C,
setpar_par2.C etc. The macros have no arguments,
e.g. setpar_par1().
3.4.3 Go4 conditions
Conditions are objects holding window limits or polygons. One or two values can be checked against the limits or the polygon, respectively. In addition the conditions have test and true counters. They can be set to return always true or false or return the inverted test result. They can be edited by the GUI (see chapter 5.8.2, page 61). They can be used to steer the analysis flow. They are saved/retrieved to/from the auto-save file, if enabled. They can be edited in the auto-save file. In the editor they can be saved/retrieved to/from files. If a mechanism like for the parameters (4) is wanted, one can use macro savecond.C([file],wildcard,prefix) from $GO4SYS/macros creating macros (one per condition) to set all conditions to their current values,. The names are built from prefix and condition name. The macro can be executed in CINT (then the conditions are taken from a file), or in the GUI or in the analysis.
Example:
root[0].x savecond.C("myfile.root","*","setcon")
would produce macros setcon_cond1.C, setcon_cond2.C etc. The macros have three arguments: restore flags, restore counters, reset counters (0=no, 1=yes), e.g. setcon_cond1(1,0,1).
3.5 Analysis base class TGo4Analysis
Once the user has defined his/her event class implementations, the analysis steps can be created and registered to the Go4 analysis framework. The actual framework consists of the TGo4Analysis class, which is a singleton (i.e. there is only one framework object in each process). This class provides all methods the user needs, it keeps and organizes the objects (histograms,...), it initializes and saves the data objects.
The user analysis is set up in a subclass of TGo4Analysis, i.e. TUserAnalysis. Constructor and destructor of this user class, in addition with the overridden virtual methods UserEventFunc(), UserPreLoop(), and UserPostLoop() specify the user analysis. If these functions are not needed, one can also use the TGo4Analysis class directly, as shown in the example Simple.
All analysis steps must be created with initial event parameters (input and output filenames) and auto-save settings. Additionally, some user objects may be created and registered here. Note that histograms created and registered here are saved to but not updated from the Go4 auto-save file. Persistent histograms of the analysis should be created in the UserPreLoop function. Existing conditions and parameters, however, are updated when the auto-save file is loaded. In the constructor of the TUserAnalysis class the analysis step objects are created, each containing instances of its user step factory. The analysis steps are registered at the TGo4Analysis framework, input and output events of subsequent steps are checked for matching. Furthermore, other objects like histograms, conditions or parameters can be created in the constructor and registered, so the framework is responsible for their persistence. Such objects can also be created in the step processors.
In addition to the event processors, the UserEventFunc() allows the user to specify analysis operations that are called once in each analysis cycle, e.g. filling certain histograms from the output events of all analysis steps. The UserEventFunc() makes it even possible to call an external analysis framework event by event without using the Go4 Analysis Steps at all, thus taking advantage of the Go4 object management and remote GUI features.
The UserPreLoop() and UserPostLoop() functions may define actions that are executed before starting, or after stopping the main analysis loop, respectively.
Once the user analysis class is defined, there are two modes of operation: The single-threaded batch mode, and the multi-threaded client mode that connects to the Go4 GUI.
3.5.1 User subclass of TGo4Analysis
Up to Go4 version 4.3 the user subclass of TGo4Analysis has been instantiated in the user main program MainUserAnalysis. In this case the arguments of the constructor could be chosen arbitrarily. With Go4 version v4.4 a standard main program (see next section) can replace the MainUserAnalysis. When using this main program the constructor of a TGo4Analysis derived user class is called with a standard argument list as it is used with main programs. The constructor of a user analysis must therefore be:
TUserAnalysis::TUserAnalysis(int argc, char** argv) : TGo4Analysis(argc, argv)
{
cout << "User analysis " << argv[0] << "created" << endl;
...
}
Note that argc is always > 0 and argv[0] is always the analysis name when called from standard main program.
Example
The user analysis could create one analysis step with input from an MBS file with the following code fragments (note that we use the standard Go4 step factory class and a fixed file name):
TUserAnalysis::TUserAnalysis(int argc, char** argv) : TGo4Analysis(argc, argv)
{
const char* userinput = “data.lmd”;
TGo4StepFactory* factory = new TGo4StepFactory("Factory");
// the objects specified here will be created by the framework later:
factory->DefEventProcessor("Proc","TUserProc");// object name, class name
factory->DefOutputEvent("Event","TUserEvent"); // object name, class name
TGo4MbsFileParameter* input = new TGo4MbsFileParameter(userinput);
TGo4AnalysisStep* step = new TGo4AnalysisStep("Analysis",factory,input,0,0);
step->SetSourceEnabled(kTRUE);
step->SetProcessEnabled(kTRUE);
AddAnalysisStep(step);
}
// Example of using the event loop
functions for a trivial counting of events
// fEvents must be defined in TUserAnalysis.h:
Int_t
TUserAnalysis::UserPreLoop() {
fEvents=0;
return 0;
}
Int_t TUserAnalysis::UserEventFunc() {
fEvents++;
return 0;
}
Int_t
TUserAnalysis::UserPostLoop() {
cout << " Total events: "
<< fEvents << endl;
return 0;
}
3.6 Main analysis program
3.6.1 The go4analysis main program
Contrary to previous Go4 versions, it is no longer required to provide a user main analysis program (typically called MainUserAnalysis). Instead, the standard go4analysis program instantiates and runs user code compiled into a shared library (typically called libGo4UserAnalysis.so). Most of the functionality previously implemented in MainUserAnalysis is now in the user analysis class (subclass of TGo4Analysis), which is instatiated by go4analysis. Existing analysis codes with explicit MainUserAnalysis program are still fully supported.
3.6.2 Command line mode (batch)
The main aim of batch mode is to process event data from files or other data source without GUI intervention. To run the analysis in batch mode, go4analysis is called from shell with several optional arguments. For instance, the command:
shell> go4analysis –file test.lmd –asf histos.root
will use file test.lmd as input and store all analysis objects (histograms, graphs) in file histos.root. The full description of the argument list is:
go4analysis
[RUN] [ANALYSIS] [STEP1] [STEP2] ...[USER]
RUN: configuration, relevant for application run mode
-lib name : user library to load
(default: libGo4UserLibrary)
-server [name] : run analysis in server mode,
name - optional analysis name
-gui name guihost
guiport : run analysis in gui mode,
used by GUI launch analysis
-http [port] : run analysis with web-server
running,
optionally port
can be specified, default 8080
-dabc
master_host:port : run analysis with
optional connection to dabc application,
which could
receive objects from running analysis
-run : run analysis in
server mode (default only run if source specified)
-norun : exclude automatical run
-number NUMBER : process NUMBER events in batch
mode
-hserver [name
[passwd]] : start histogram server
with optional name and password
-log [filename] : enable log output into filename
(default:go4logfile.txt)
-v -v0 -v1 -v2
-v3 : change log output
verbosity (0 - maximum, 1 - info, 2 - warn, 3 -errors)
-rate : display rate
information during run
-print [sub=N]
[hex|dec] : print events, see -help
print for more info
-help [topic] : show this help or for selected
topic
ANALYSIS: common analysis configurations
-name name :
specify analysis instance name
-asf [filename] :
enable store autosave file and set autosave filename (default
<Name>ASF.root)
-enable-asf
[interval] : enable store of autosave
file, optionally interval in seconds
-disable-asf :
disable usage of asf
-prefs
[filename] : load preferences (analysis configuration)
from specified file (default Go4AnalysisPrefs.root)
-no-prefs :
disable preferences loading
-maxtreesize
value : define maximum tree size, value can be: 2g,
1900m, 1900000000
STEP: individual step configurations
-step name :
select step by it's name, if not found, first step will be used
-step number :
select step by it's number (first step has number 0)
-enable-step :
enable step processing
-disable-step :
disable step processing
-file filename :
use file filename (lmd or lml) as MBS event source
-transport
server : connect to MBS transport server
-stream server :
connect to MBS stream server
-evserv server :
connect to MBS event server
-revserv server
[port] : connect to remote event server
-port number :
select custom port number for event source
-retry number :
select number of retries when connection to source was lost
-random :
use random generator as source
-user name :
create user-defined event source
-source
filename : read step input from the root file
-skip num :
skip num first events in mbs event source
-mbs-select first
last step : select events interval from mbs source
-timeout tm :
specify timeout parameter for event source
-enable-source :
enable step source
-disable-source :
disable step source
-store filename
[split buffersize compression] : write
step output into the root file
-overwrite-store : overwrite file, when store output
-append-store :
append to file, when store output
-backstore name :
create backstore for online tree draw
-enable-store :
enable step store
-disable-store :
disable step store
-enable-errstop :
enable stop-on-error mode
-disable-errstop : disable stop-on-error mode
-inpevt-class
name :
(re)define class name of input event
-outevt-class
name :
(re)define class name of output event
USER: user-defined arguments
-args [userargs] :
create user analysis with constructor (int argc, char** argv) signature
all following arguments will be provided as array of strings, first argument
- analysis name
A list of valid arguments can be obtained by launching go4analysis without any arguments. Execution of go4analysis can be terminated by pressing Ctrl-C. The analysis will regularly close all event sources, store results of processing in output files and then exit.
3.6.3 Creating the user analysis
On startup go4analysis loads the shared user library and instantiates the user analysis. There is a possibility to pass extra configuration parameters to the user analysis constructor, calling go4analysis with -args or -x followed by a user specific parameter list. This list is passed to the analysis constructor:
Example
shell> go4analysis –name TestAna –args xxx.lmd
TUserAnalysis::TUserAnalysis(int argc, char** argv) : TGo4Analysis(argc, argv)
{
// argc is 2
// argv[0] is "TestAna"
// argv[1] is "xxx.lmd"
const char* userinput = “default.lmd”;
cout << "User analysis " << argv[0] << "created" << endl;
if (argc>1) userinput = argv[1];
TGo4MbsFileParameter* input = new TGo4MbsFileParameter(userinput);
...
}
Similar to the
argument list of the main() function argc defines number of parameters and argv contains parameter
values. First parameter in the list is always the analysis instance name (either
set in the GUI launch panel or by
–name argument, default is Go4Analysis). When go4analysis is started without user-specific arguments, only analysis
name will be in the list and argc is 1. The user argument list can also be specified in the Analysis launch
panel of the GUI.
3.6.4 Default user analysis
In simple cases (only one step) it is not necessary to implement a user-specific analysis class at all. It is sufficient to implement a processor (and optionally an output event) class. In this case go4analysis will search for such classes in the loaded library and instantiate them, using the default TGo4Analysis instance and creating one default analysis step (named Analysis).
3.6.5 Analysis controlled by Go4 GUI
In the interactive GUI mode go4analysis provides all the infrastructure needed to manage the connection to the GUI. Usually, the Go4 GUI is started first and than user launches the analysis program via Launch analysis. Mainly for debugging purposes one can instead use in the GUI Prepare for client connection menu command and than start the analysis in an independent shell by command (same as it is called by GUI):
shell> go4analysis –gui SomeName guihost 5000
Here SomeName is an arbitrary analysis name, guihost is the host name where the GUI is started and 5000 is the port number (may be different, is printed when GUI starts). Same input/output arguments, as in batch mode, can be specified behind. On startup go4analysis creates the analysis framework and connects the multi-threaded analysis client to the Go4 GUI. After the connection is established, the complete analysis framework can be controlled from the GUI. In section 3.6.10, page 19 we describe in detail what is happening on startup of the analysis client and what effect the GUI control actions have.
3.6.6 Analysis as server for multiple Go4 GUIs
When started from the GUI the analysis connects only this GUI and absolutely depends from it. If something happens with GUI or GUI just closed, analysis execution will be terminated. However, it is possible to run the analysis as a server, which allows to connect many GUIs (one controlling GUI and many observer GUIs).
The analysis is started as server independently from the GUI from a shell like in the batch mode but with argument –server
shell> go4analysis –server –stream mbs-server -norun
As in batch mode, in server mode analysis will start its event loop if input was specified. To prevent this, the -norun argument can be add. To force event loop execution with default analysis parameters, -run argument should be specified. An analysis to run in server mode can also be launched via Launch analysis menu command of the Go4 GUI when selecting the mode as server.
A Go4 GUI is able to connect any such started server. Login of GUI to the analysis server may be with observer, controller, or administrator role, respectively; their passwords can be set in user analysis code with DefineServerPasswords() method. There can be only one controller or administrator, but multiple observer GUIs. Observers may only view existing objects, but may not modify them or change analysis setup and running state. Controller may view and modify objects and analysis configuration, but is not allowed to terminate analysis server. Only Administrator may shutdown the analysis server.
See section 5.3.2, page 39 for more details on connection of the GUI client.
3.6.7 Configuration of analysis
There are several methods to configure the analysis which can be combined in a defined order:
Constructor of user analysis class
In any case the constructor is called first. All steps must be created. One may set up all steps like setting input and output filenames, enable/disable steps. One may excecute a macro for that. One may use user arguments given by go4analysis command (behind –x) or in the Launch analysis panel (Args).
Go4 preferences file
When launched from GUI, or started from shell by go4analysis command with the –server or –gui option,
and settings had been saved before, these settings are now loaded from the file
overwriting the coded setup. Default file name is Go4AnalysisPrefs.root. With –noprefs or –prefs <file> one can disable this loading or specify a different file, respectively. In
the Analysis configuration panel a different file also can be loaded.
Arguments to go4analysis
When started from shell now the arguments of go4analysis are used and
overwrite the settings.
Hotstart file
When launched from GUI with hotstart file the complete setting from that file is used and overwrites the settings.
3.6.8 Support of older analysis code
In previous go4 versions up to 4.3 it was required to have a user MainUserAnalysis program which was launched via the AnalysisStart.sh script. In most cases that executable can be used as is. Since version 4.4 the GUI directly calls the MainUserAnalysis executable (or program or script as specified in the Launch Analysis panel, see section 5.3, page 38) with same argument list as before. When AnalysisStart.sh script had been modified and therefore the old launch sequence is required, one should set shell variable GO4OLDLAUNCH=yes before starting the GUI.
In many real cases the go4analysis is able to correctly instantiate the user analysis, compiled into libGo4UserAnalysis.so library even if no (int, char**) constructor signature is implemented. To facilitate new Go4 functionality and flexibility, it is recommended to move user code from MainUserAnalysis to user analysis class, (i.e. TUserAnalysis) and remove MainUserAnalysis.
3.6.9 Setting up ssh keys
For launching the analysis on remote host from the GUI, password-less ssh login on this host must be enabled. It means, when typing “ssh hostname” command in the shell, no any password shall be requested. To configure such password-less login, a private/public key pair must be created and the public key must be copied to remote host:
shell> ssh-keygen –t rsa
shell> ssh-copy-id -i ~/.ssh/id_rsa.pub hostname
From historical reason there is still rudimentary support of rsh for analysis launch. rsh in no longer supported in GSI, therefore it is not so good tested as other launch methods. For use of rsh, make sure that the file .rhosts exists in user home directory and that it contains entries for the machine names you want to run the Go4 analysis client on. The file .rhosts could e.g. look like this:
node01
node02
localhost
3.6.10 Start-up of GUI controlled analysis
When starting the Go4 analysis from GUI, the following actions take place in that order:
1.
The Launch
Analysis GUI panel started by ![]() reads settings from file $GO4SYS/etc/go4.prefs. Based on settings in this file, the launch command is composed and
executed. Depending on the analysis mode (client or server) either -server or
-gui argument lists are passed to the executable.
reads settings from file $GO4SYS/etc/go4.prefs. Based on settings in this file, the launch command is composed and
executed. Depending on the analysis mode (client or server) either -server or
-gui argument lists are passed to the executable.
2. TGo4Analysis or user subclass (e.g. TUserAnalysis) is instantiated and initializes the analysis framework.
3. The analysis, if in client mode, connects to the Go4 GUI. Optionally, the Go4 histogram/object server is created. Note that the analysis in server mode does not connect automatically to the starting GUI, but waits for a separate connect request with login and password from any GUI. Only after this explicit connection the GUI gets control over the analysis server!
4.
The analysis settings are
loaded from the default preferences file Go4AnalysisPrefs.root. A message is sent to the GUI (if successful):
“Analysis
Client MyClient: Status Loaded from file Go4AnalysisPrefs.root”
Note that all settings specified before
in the compiled code (auto-save file name, event sources, etc.) are overwritten
if the preferences file exists.
5. The configuration settings are now changed by additional arguments, provided to go4analysis executable.
6.
The analysis objects are loaded
and updated from the auto-save file. The file name from the loaded analysis
settings is used, if existing. Otherwise, the filename specified in the
preceding user code by SetAuto-saveFile(const
chart* name) is used. If successful, a message is
sent to the GUI:
”Analysis
Client MyClient: Objects Loaded”.
If auto-saving was disabled completely by calling
SetAutoSave(kFALSE), the auto-save file is not opened here even if it exists, and no
objects are loaded! The “overwrite filename” option in the auto-save
settings must be disabled to recover objects of a previous auto-save file;
otherwise, all objects in an old file of the same name are lost!
7. The analysis settings are displayed on the GUI. At this moment, the analysis configuration window pops up and shows the active settings. Note that a GUI, connected to an analysis server, only in administrator mode can change the analysis configuration.
8.
End of analysis start-up. A
message is sent to the GUI:
“Analysis
Client MyClient has finished initialization”.
Note that now the analysis itself is not yet
initialized, i.e. the event and processor objects have not been created, and there are still no connections to event sources, etc.
3.6.11 Submit settings and run analysis
At any
time the user may apply new settings to the analysis and start/stop the run. Note
that if the GUI runs as client connected to an analysis server, these
operations are permitted for controller or administrator login only. The
following is happening in the described order:
1. Submit the analysis settings. The settings as displayed in the analysis configuration window are sent to the analysis client.
i. First, an already existing analysis is closed (see below).
ii. The analysis is initialized with the new settings. Objects are loaded from the new auto-save file except auto-save is disabled by SetAutoSave(kFALSE). The file name is as specified in the configuration window.
iii. The event objects are created. Event sources and stores are opened. The constructors of all user events and event processors are executed. Note that any object (histogram, parameter, etc) which is created and registered in the user event constructors might replace an object of same name that was loaded from the auto-save file before! To continue working with the loaded objects, the user should request pointer to the object by name from the framework here. Only if the object was not found it should be created anew. Since Go4 v4.4 there are methods to return references to objects which are created only if not loaded from auto-save file.
After
submit, the Analysis browser can be refreshed by ![]() . When an analysis was running before, the new
analysis is started immediately and the refresh is done automatically.
. When an analysis was running before, the new
analysis is started immediately and the refresh is done automatically.
2.
Start the analysis with ![]() :
:
i. The Go4 GUI will send the start command and refresh the view in the analysis browser.
ii. The UserPreLoop() function is executed once. Here transient pointers to data might be initialized, values from a user file might be read, etc.
iii. The Analysis event loop is starting. For each event the analysis steps, the dynamic list entries, and the UserEventFunc() are executed. The loop will run until the event source is at the end, an error occurs, or the stop command is applied by the user.
3.
Stop the analysis with ![]() :
:
i.
The event loop is halted. This
will not close the analysis itself, i.e. all event objects still exist, event
sources and -stores are still open. When restarting the analysis by ![]() ,
it will continue with the next event.
,
it will continue with the next event.
ii. The UserPostLoop() function is executed once. Here transient pointers should be reset to 0, user files might be written or closed, etc.
4. Save configuration settings: At any time the current settings can be saved to a preferences file. This will not affect the running analysis. Note that after changing the settings in the analysis configuration window they must first be submitted to save them!
5.
Load Settings: Loading analysis settings from a preferences file will
immediately close the running analysis. The closing actions are just as
described below. However, the loaded settings are not initialized until they
have been Submitted again from
the analysis configuration window!
3.6.12 Shutdown of the analysis client
The
analysis client is shut down with the ![]() button. This will take the following actions:
button. This will take the following actions:
1. The connection between analysis and GUI is closed.
2. The destructor of the user analysis class is executed.
3.
Close of the analysis (this step can be executed by button ![]() ):
):
i. Objects are written to the previous auto-save file, if SetAutoSave(kTRUE).
ii. The event objects are deleted. Go4 event sources (.lmd files and MBS connections) are closed. Event stores (.root files) are finally written and closed. The destructors of all user events and event processor classes are executed. All references to the event objects are deleted from the Go4 folders.
iii. The dynamic list is reset. All pointers to non existing objects are cleaned up.
4. The analysis client executable terminates. The Go4 GUI is ready to connect the next analysis client.
3.6.13 Disconnect or shutdown analysis server
The GUI may
disconnect the analysis server with the ![]() button. This
will neither stop the analysis nor shutdown the server task, but just close the
connections to this GUI. Additionally, when connected to an analysis
server, the GUI has a
button. This
will neither stop the analysis nor shutdown the server task, but just close the
connections to this GUI. Additionally, when connected to an analysis
server, the GUI has a ![]() button in the analysis toolbar and a menu for Shutdown Analysis server. This is permitted in administrator mode only! This will take the
following actions:
button in the analysis toolbar and a menu for Shutdown Analysis server. This is permitted in administrator mode only! This will take the
following actions:
1.
Analysis server broadcasts
message about shutdown to all GUI clients connected. The GUIs will cease
monitoring activities and prepare for disconnect.
2.
The destructor of the user
analysis class is executed.
3.
Close of the analysis, see details in 3.6.12
4.
The analysis server disconnects
all GUI clients fast, i.e. without handshaking protocol, and terminates.
4 Analysis Examples
To begin with Go4, there are examples of analysis packages at $GO4SYS/Go4ExampleSimple, $GO4SYS/Go4Example1Step, $GO4SYS/Go4Example2Step, $GO4SYS/Go4ExampleAdvanced, $GO4SYS/Go4ExampleUserSource and $GO4SYS/Go4ExampleMesh. The differences are:
|
Example |
Analysis |
Step
factories |
Event
objects |
Steps |
|
Simple |
TGo4Analysis |
TGo4StepFactory |
TGo4EventElement |
Analysis |
|
1Step |
TXXXAnalysis |
TGo4StepFactory |
TXXXEvent |
Analysis |
|
2Step |
TXXXAnalysis |
TXXXUnpackFact |
TXXXUnpackEvent |
Unpack |
|
Advanced |
TXXXAnalysis |
TXXXUnpackFact |
TXXXUnpackEvent |
Unpack |
|
UserSource |
TYYYAnalysis |
TYYYUnpackFact |
TYYYRawEvent TYYYUnpackEvent |
Unpack |
|
Mesh |
TMeshAnalysis |
TGo4StepFactory |
|
13 different |
4.1 Analysis design
If one is going to develop a new analysis with Go4 it is recommended to start with one of the examples. The question is which one? To make this decision easier, here some considerations:
How many steps do I need? The usage of steps has two aspects:
ð modularity of the code: what is the natural granularity. Unpack, calibrate, filter, physics? Subdetectors?
ð design of data generations. Are there event filters?
ð storage versus computing. Are the processed data bigger than the raw? Is the analysis compute bound?
Modularity of analysis code could be achieved in a single step simply by a chain of function calls of one or several classes. However it would get complicated if one wants to disable functions because their successing function would need their data. This problem is solved by Go4 steps. The events filled by the step processors can be stored in ROOT files (trees). The steps produce data generations. These files can then be used as input for subsequent steps replacing the generating step which can be disabled. With two steps one needs at least one output event (filled and stored by first step) and processed by second step. Note that ROOT files produced by any step can be processed by stand-alone macros. In this sense there can be always a final step outside Go4 processing the files of the last step.
Therefore one should first think about data generations and structures.
4.1.1 Simple
Start with this example if you want just produce histograms from raw data. All coding is in one file. No output event file can be written. Histograms can be saved in ROOT file.
4.1.2 One step
This example has an output event which can be stored in a ROOT file which can be processed by macros. In addition it has a user analysis class where the functions UserPreLoop, UserPostLoop and UserEventFunc are implemented.
4.1.3 Two step
In addition we have here two steps. This example also demonstrates how one can configure the analysis completely by a setup macro.
4.2 Using the examples at GSI
When using Go4 at GSI where it is already installed, Go4 is set up by
. go4login
Note that there must be a space behind the dot. To see all relevant environment variables use command
go4version
The output of this command would be helpful if you report problems.
Analysis example programs are started by
go4analysis
or from the GUI which is started by
go4
4.3 Prepare the packages
Copy the content of the directory $GO4SYS/Go4Example1(2)Step to a separate location. You can directly make and run the example. The package consists of the following files:
· Readme.txt
· Makefile
· Declaration (*.h) files
· Implementation (*.cxx) files
· XXXLinkDef.h - ROOTCINT class pragma definitions
Cleanup all previously generated files by:
shell> make clean
In all examples there is one string included in all class and file names: “XXX”. It is recommended to replace this by another string more specific for user task. This is done by rename.sh script, provided together with Go4 distribution. For example, change to “Ship” can be done with:
shell> $GO4SYS/build/rename.sh "XXX" "Ship"
Note that "Ship" will be part of all class and file names, therefore do not use a string which is already in any filename!
To build example, just:
shell> make all
This will create shared library libGo4UserAnalysis.so and libGo4UserAnalysis.rootmap.
4.4 Simple example with one step
The package $GO4SYS/Go4ExampleSimple contains a simplest running Go4 analysis. It contains only one default analysis step and uses the standard Go4 analysis classes TGo4Analysis, TGo4StepFactory and TGo4EventElement. Therefore the functions UserPreLoop(), UserPostLoop(), and UserEventFunc() are not available. No data can be stored in the output event. The example uses some conditions and some parameter objects. The step is reading events from a standard MBS event source, preferably the MBS random source, filling some histograms. No output file is written. The analysis processes up to eight long word values from up to two sub events.
Analysis must be launched via library libGo4UserAnalysis.so.
4.4.1 Event processor
Processor class: TXXXProc
The analysis, analysis factory, and analysis step (all standard Go4 classes) are created in the go4analysis program automatically. The input can be specified via go4analysis input arguments. The only custom code is implemented in processor class. No user event class is used in this example. Members of TXXXProc are histograms, conditions and parameter pointers. In the constructor of TXXXProc the histograms, parameters and conditions are created. Method BuildEvent() - called event by event - gets a dummy output event pointer as argument, but cannot fill any output data. The input event pointer is retrieved from the framework. In the first part, data from the raw input MBS event are copied to arrays of TXXXProc. Two sub-events (crate 1,2) are processed. Then the histograms are filled, the 2d one with polygon conditions.
4.4.2 Parameters
Parameter class TXXXParam
In this class one can introduce parameters values and use them in all steps. Parameters can be modified from GUI.
4.4.3 Auto-save file mechanism
See also chapter 5.4.4, page 43. By default auto-save is enabled for batch, disabled with the GUI. The name of the file is built from the name of input (file, server) like <input>_AS.root. If autosave file enabled all objects are saved into this ROOT file at the end of the event loop. At startup the auto-save file is read and all objects are restored from that file. From GUI, objects are loaded from auto-save file when the Submit button is pressed. Note that histograms are not cleared. One can inspect the content of the auto-save file with the Go4 GUI.
4.4.4 Example log file
All lines with **** are from the example classes.
shell> go4analysis -random
-number 100000
Event processor TXXXProc of name
XXXProc
Output event TGo4EventElement of
name XXXOutputEvent
GO4-*> Welcome to Go4 Analysis
Framework Release v4.3.2 (build 40302) !
GO4-*> Create factory Factory
GO4-*> Analysis: Added analysis
step Analysis
**** Main: starting analysis in
batch mode ...
GO4-*> Opening AutoSave file
Go4AutoSave.root , UPDATE mode
GO4-*> Analysis LoadObjects:
Loading from autosave file Go4AutoSave.root
LoadObjects with Dirscan...
GO4-*> AutoSave file
Go4AutoSave.root was closed.
GO4-*> Factory: Create input
event for MBS
**** Event MbsEvent-10-1 has source
Random class: TGo4MbsRandom
GO4-*> Factory: Create event
processor XXXProc
**** TXXXProc: Create instance
XXXProc
GO4-*> Factory: Create output
event XXXOutputEvent
**** Event XXXOutputEvent has
source XXXProc class: TXXXProc
GO4-*> AnalysisStepManager --
Initializing EventClasses done.
GO4-*> Analysis BaseClass
-- Initializing EventClasses done.
GO4-*> Analysis loop for 100000
cycles is starting...
GO4-*> Analysis Implicit Loop
has finished after 100000 cycles.
GO4-*> Opening AutoSave file
Go4AutoSave.root , RECREATE mode
GO4-*> AutoSave file
Go4AutoSave.root was closed.
**** TXXXProc: Delete instance
GO4-*> Analysis Step
Manager -- Analysis Steps were closed.
**** Main: Done!
4.4.5 Adapting the example
Creating a new class
Provide the definition and implementation files (.h and .cxx)
Add class in XXXLinkDef.h
Then make all.
Most probably you will change TXXXParam to keep useful parameters.
Then definitely you will change TXXXProc to create your histograms, conditions, pictures, and finally write your analysis function BuildEvent().
4.5 Example with one step
The package $GO4SYS/Go4Example1Step contains a Go4 analysis with one analysis step. It uses the standard Go4 step factory TGo4StepFactory, but a user written TXXXAnalysis. In this class the functions UserPreLoop(), UserPostLoop(), and UserEventFunc() can be used. It uses some conditions and some parameter objects. The step is reading events from a standard MBS event source, preferably the MBS random source, filling some histograms and an output event. The analysis processes up to eight long word values from up to two sub events. All classes are defined and declared in two files (*.h and *.cxx). Additional descriptions are in the source files.
Analysis must be launched via library libGo4UserAnalysis.so.
4.5.1 Analysis class
Analysis class: TXXXAnalysis
In TXXXAnalysis the analysis step is created with the step factory and input and output parameters. Here the defaults are set concerning the event IO. Parameter objects of class TXXXControl also created.
4.5.2 Analysis step
Event class: TXXXEvent
Processor class: TXXXProc
The standard factory created in TXXXAnalysis keeps all information about the step. The TXXXEvent contains the data members to be filled in TXXXProc from the input event (MBS 10-1). The Clear() method must clear all these members (an array for each crate in the example). In the constructor of TXXXProc the histograms and conditions are created, and the pointers to the parameter objects (created in TXXXAnalysis) are retrieved. Function BuildEvent() - called event by event - gets the output event pointer as argument (TXXXEvent). The input event pointer is retrieved from the framework. In the first part, data from the raw input MBS event are copied to the members of output event TXXXEvent. Two sub-events (crate 1,2) are processed. Then the histograms are filled, the 2d one with polygon conditions.
4.5.3 Parameters
Parameter class TXXXControl
This class has one member "fill" which is checked in TXXXProc->BuildEvent() to
fill histograms or not. The macro
setfill.C(n), n=0,1 can be used in the GUI to switch the filling on or off. It
creates macro histofill.C() which is actually used to set filling on or off (in TXXXProc). You can also modify histofill.C by editor before running
the analysis.
4.5.4 Auto-save file mechanism
See also chapter 5.4.4, page 43. By default auto-save is enabled for batch, disabled with GUI. The name of the file is built from the input by
<input>_AS.root
If it is enabled all objects are saved into this ROOT file at the end of the event loop. At startup the auto-save file is read and all objects are restored from that file. When TXXXAnalysis is created, the auto-save file is not yet loaded. Therefore the objects created here are overwritten by the objects from auto-save file (if any), except histograms. From GUI, objects are loaded from auto-save file when the Submit button is pressed. Note that histograms are not cleared. One can inspect the content of the auto-save file with the Go4 GUI. Note that appropriate user libraries should be loaded into GUI to access data from auto-save file (see chapter 5.2, page 37).
4.5.5 Example log file
All lines with **** are from the example classes.
shell> go4analysis
-file /GSI/lea/gauss.lmd
GO4-*> Welcome to Go4 Analysis Framework Release v4.3.2 (build
40302) !
GO4-*> Create factory Factory
**** Analysis: Create file input file.lmd
GO4-*> Analysis: Added analysis step Analysis
**** Main: starting analysis in batch mode ...
GO4-*> Opening AutoSave file Go4AutoSave.root , UPDATE mode
GO4-*> Analysis LoadObjects: Loading from autosave file
Go4AutoSave.root
LoadObjects with Dirscan...
GO4-*> AutoSave file Go4AutoSave.root was closed.
GO4-*> TGo4MbsFile: Open file /GSI/lea/gauss.lmd
GO4-*> Factory: Create input event for MBS
**** Event MbsEvent-10-1 has source /GSI/lea/gauss.lmd class:
TGo4MbsFile
GO4-*> Factory: Create event processor XXXProc
**** TXXXProc: Create instance XXXProc
**** TXXXControl: Histogram filling enabled
**** TXXXProc: Produce histograms
**** TXXXProc: Produce conditions
**** TXXXProc: Create condition
**** TXXXProc: Produce pictures
GO4-*> Factory: Create output event XXXEvent
**** TXXXEvent: Create instance XXXEvent
**** Event XXXEvent has source XXXProc class: TXXXProc
GO4-*> AnalysisStepManager
-- Initializing EventClasses
done.
GO4-*> Analysis BaseClass --
Initializing EventClasses done.
**** TXXXAnalysis: PreLoop
Input file: gauss.lmd
Tapelabel: DISK
UserName: goofy
RunID:
Explanation:
Comments:
GO4-*> Analysis loop is starting...
**** TXXXProc: Skip trigger event
First event #: 1
GO4-*> End of event source TGo4MbsFile:
/GSI/lea/gauss.lmd
-I-f_evt: no more event
**** TXXXAnalysis: PostLoop
Last event #: 16605 Total
events: 16605
GO4-*> Go4 EventEndException
appeared after 0 cycles.
**** TXXXAnalysis: Delete instance
GO4-*> Opening AutoSave file Go4AutoSave.root , RECREATE mode
GO4-*> AutoSave file Go4AutoSave.root was closed.
**** TXXXEvent: Delete instance
**** TXXXProc: Delete instance
GO4-*> Analysis Step Manager
-- Analysis Steps were closed.
**** Main: Done!
4.5.6 Adapting the example
Creating a new class
Provide the definition and implementation files (.h and .cxx)
Add class in Go4UserAnalysisLinkDef.h
Then make all.
Most probably you will change TXXXParam to keep useful parameters.
Then you might change TXXXEvent to represent your event data.
Keep the Clear() method consistent with the data members!
Then definitely you will change TXXXProc to create your histograms, conditions,
pictures, and finally write your analysis function BuildEvent().
In TXXXAnalysis there are three more functions which eventually can be useful:
UserPreLoop () - called before event loop starts,
UserEventFunc() - called after each TXXXProc::BuildEvent(),
UserPostLoop () - called after event loop stopped.
4.6 Example with two steps
The package $GO4SYS/Go4Example2Step contains an unpack step and an analysis step. It uses some conditions and some parameter objects. Step one is reading events from a standard MBS event source, preferably the MBS random source, filling some histograms and an output event. Step two uses this event as input and fills another output event and some more histograms. The analysis processes up to eight long word values from up to two sub-events.
The events are read from standard GSI event sources (in the GUI one can switch to MBS or event servers). Then the first user event processor is called (Unpack). This user event processor fills some histograms and the first user event (unpacked event) from MBS input event. Then the second user event processor is called (Analysis). This user event processor fills some other histograms and the second user event (calibrated event) from the first event. The events from the first and second step can optionally be stored in ROOT files (enabled from GUI). When a ROOT file with unpacked events exists, the first step can be disabled, and this file can be selected as input for the second step (from GUI).
In TXXXAnalysis the two steps are created. Here the defaults are set concerning the event IO. Then macro setup.C is executed at the end of TXXXAnalysis. Analysis must be launched from GUI via library libGo4UserAnalysis.so.
4.6.1 Setup in setup.C
The whole step setup is done in macro setup.C. It gets two strings as argument which can be specified in command line
go4analysis
–x <type> <name>
or in the GUI Launch panel in the Args field. In setup.C the type string is used to determine the type of the source, the name string is used to compose file names:
idir/name.lmd or if string starts with @ @idir/name.lml
odir/name_AS.root
odir/name_unpacked.root
odir/name_analyzed.root
idir
and odir are
directories for the input and output files also specified in setup.C.
If the source type specified (-random, -transport, -stream, -file) is no file, name is used as MBS node name. When started from GUI, any Go4AnalysisPrefs file overwrites the settings from setup.C. When started from shell make sure that setup.C is correct!
4.6.2 Step one: unpack
The event filled: TXXXUnpackEvent
The processor: TXXXUnpackProc
The TXXXUnpackEvent contains the data members to be filled from the input event (MBS 10,1). Only the Clear() method must be changed to clear all these members.
The unpacking code is in the event processor TXXXUnpackProc. Members are histograms, conditions, and parameter pointers used in the event method BuildEvent().. In the constructor of TXXXUnpackProc the histograms and conditions are created, and the pointers to the parameter objects (created in TXXXAnalysis) are set. BuildEvent() called event by event and gets the output event as argument. The input event is retrieved from the framework. The first eight channels of crate one and two are filled in histograms Cr1Ch01-08 … Cr2Ch01-08, respectively. His1g is filled under condition cHis1 on channel 0, His2g under condition cHis2 on channel 1. When editing conditions cHis1,2 histograms His1,2 filled by channel 0,1 will be displayed automatically to set/display the condition values. Picture condSet shows histograms His1,2 on top, His1,2g at bottom. Open the condition editor in the view panel of the picture. Conditions cHis1,2 will be selectable. They are displayed in the pad where they should be set. Both conditions are attached to the picture (see chapter 5.8.4, page 63). Histogram Cr1Ch1x2 is filled for three polygon conditions: polycon, polyconar[0], polyconar[1], all on the same values as the histogram.
4.6.3 Steering methods in processor function BuildEvent
Processing the input event and filling an output event it might be necessary to control the following behaviour:
1. Specify if the output event shall be written to output file (if enabled)
Bool_t isValid;
. . . . – code - . . .
out_evt->SetValid(isValid); // isValid
must be set before to kTRUE or kFALSE
return isValid;
Note
that the default calling Fill method
will set the validity of out_evt to the return value! If one would have a Fill method implemented in TXXXUnpackEvent calling BuildEvent the return value could be
handled differently there. A subsequent step should
check at the beginning if the input event (output event from previous step) was
valid. If not, it should mark its own output event also not valid and return:
Bool_t isValid=kFALSE;
if((inp_evt==0) || !inp_evt->IsValid()){
// input invalid
out_evt->SetValid(isValid); // invalid
return isValid; // return the same validity
}
isValid=kTRUE;
. . . . – code - . . .
out_evt->SetValid(isValid);
return isValid;
2. Specify if the following steps shall be skipped (optional message) by macro calls
GO4_SKIP_EVENT
GO4_SKIP_EVENT_MESSAGE("Skipped Event
%d",count-1)
3. Specify if the analysis shall be stopped immediatedly by macro calls
GO4_STOP_ANALYSIS
GO4_STOP_ANALYSIS_MESSAGE("Stopped after
Event %d",count-1)
4.6.4 Step two: analysis
The event filled: TXXXAnlEvent
The processor: TXXXAnlProc
The step two is build in the same way as step one.
Note that the TXXXUnpackEvent is used two times: once as output of step one, and once as input of step two.
The TXXXUnpackEvent instance can be filled by previous unpack step, or can be retrieved from input file. Step one must be disabled in the second case. The user method BuildEvent() always gets the pointer to the correct event. Histogram Sum1 is filled by first 4 channels of crate 1 and first 4 channels of crate 2. All channels are gated with condition wincon1. Histograms Sum2,3 are filled similar, but without gate, and shifted by XXXPar1,2->frP1. Histogram Sum1calib is filled like Sum1 without gate but with values calibrated by method TXXXCalibPar->Energy() of parameter calipar.
4.6.5 Parameters
With the TXXXParameter class one can store parameters, and use them in all steps. Parameters can be modified from GUI by double click. There is a macro setparam.C which sets the values. One can disable histogramming in both steps. This doubles the processing speed and is useful if one only wants to create listmode files.
4.6.6 Conditions
There are a few conditions created in TXXXUnpackProc. One (polycon) is used in XXXUnpack() for the accumulation of histogram Cr1Ch1x2. Another one (wincon1) is used in BuildEvent() of TXXXAnlProc to fill histogram Sum1. Conditions can be modified by double click in the browser. One can attach a histogram to a condition or attach conditions to picture pads to ensure that the condition is displayed/set on the proper display.
4.7 Example with some advanced tecniques
The package $GO4SYS/Go4ExampleAdvanced contains an unpack step and an analysis step. It uses some conditions and some parameter objects. Step one is reading events from a standard MBS event source, preferably the MBS random source, filling some histograms and an output event. Step two uses this event as input and fills another output event and some more histograms. The analysis processes up to eight long word values from up to two sub events.
The events are read from standard GSI event sources (in the GUI one can switch to MBS or event servers). Then the first user event processor is called (Unpack). This user event processor fills some histograms and the first user event (unpacked event) from MBS input event. Then the second user event processor is called (Analysis). This user event processor fills some other histograms and the second user event (calibrated event) from the first event. The events from the first and second step can optionally be stored in ROOT files (enabled from GUI). When a ROOT file with unpacked events exists, the first step can be disabled, and this file can be selected as input for the second step (from GUI).
In TXXXAnalysis the two steps are created with their factories and input and output parameters. Here the defaults are set concerning the event IO. When called with a user argument, setup.C macro is executed at the end of TXXXAnalysis.
Two parameter objects are created (TXXXParameter). They can be used in both steps.
Analysis must be launched from GUI via library libGo4UserAnalysis.so, or from shell by
go4analysis –args file
4.7.1 Step one: unpack
The event filled: TXXXUnpackEvent
The processor: TXXXUnpackProc
The TXXXUnpackEvent contains the data members to be filled from the input event (MBS 10,1). In contrast to the Go4Example2Step, we apply the TGo4CompositeEvent classes here. Details on the event structure are discussed in Chapter 8 on page 81.
The unpacking code is in the event processor TXXXUnpackProc. Members are histograms, conditions, and parameter pointers used in the event method BuildEvent().. In the constructor of TXXXUnpackProc the histograms and conditions are created, and the pointers to the parameter objects (created in TXXXAnalysis) are set. BuildEvent() called event by event and gets the output event as argument. The input event is retrieved from the framework. The first eight channels of crate one and two are filled in histograms Cr1Ch01-08 … Cr2Ch01-08, respectively. His1g is filled under condition cHis1 on channel 0, His2g under condition cHis2 on channel 1. When editing conditions cHis1,2 histograms His1,2 filled by channel 0,1 will be displayed automatically to set/display the condition values. Picture condSet shows histograms His1,2 on top, His1,2g at bottom. Open the condition editor in the view panel of the picture. Conditions cHis1,2 will be selectable. They are displayed in the pad where they should be set. Both conditions are attached to the picture (see chapter 5.8.4, page 63). Histogram Cr1Ch1x2 is filled for three polygon conditions: polycon, polyconar[0], polyconar[1], all on the same values as the histogram.
4.7.2 Step two: analysis
The event filled: TXXXAnlEvent
The processor: TXXXAnlProc
The step two is build in the same way as step one.
Note that the TXXXUnpackEvent is used two times: once as output of step one, and once as input of step two.
The TXXXUnpackEvent instance can be filled by previous unpack step, or can be retrieved from input file. Step one must be disabled in the second case. The user method BuildEvent() always gets the pointer to the correct event. Histogram Sum1 is filled by first 4 channels of crate 1 and first 4 channels of crate 2. All channels are gated with condition wincon1. Histograms Sum2,3 are filled similar, but without gate, and shifted by XXXPar1,2->frP1. Histogram Sum1calib is filled like Sum1 without gate but with values calibrated by method TXXXCalibPar->Energy() of parameter calipar.
4.7.3 Parameters
With the TXXXParameter class one can store parameters, and use them in all steps. Parameters can be modified from GUI by double click.
TXXXCalibPar is an example how to use fitters in parameters to calibrate histograms (more chapter 5.11.3, page 69). Please have a look at the Readme.txt file in this example directory for a detailled description of the calibration procedure.
4.7.4 Conditions
There are a few conditions created in TXXXUnpackProc. One (polycon) is used in XXXUnpack() for the accumulation of histogram Cr1Ch1x2. Another one (wincon1) is used in BuildEvent() of TXXXAnlProc to fill histogram Sum1. Conditions can be modified by double click in the browser. One can attach a histogram to a condition or attach conditions to picture pads to ensure that the condition is displayed/set on the proper display.
4.8 Example of analysis with a user defined event source
The package Go4ExampleUserSource shows a simple example of a user defined event source reading data from an ASCII text file. Like the one step example, the package can be copied to a user working environment, and the class names can be renamed replacing the “TYYY-” prefix.
To apply a user defined event source, method CreateEventSource() of the user step factory must be re-implemented to react on a TGo4UserSourceParameter when selected in the controlling GUI, or set as argument for the go4analysis batch executable . It should then create a TGo4EventSource subclass that the user implements for his purpose. Note that method CreateInputEvent() should also be overwritten to create a raw event matching to the user event source, since the default of the base class TGo4EventServerFactory always delivers a TGo4MbsEvent.
In this example the event source class TYYYEventSource is prepared to handle any ASCII file containing columns of data separated by blank spaces. Each row is read and its values are converted in order into the Double_t fdData array of the raw event class TYYYRawEvent. The array expands automatically depending on the number of columns. Lines starting with “!” or “#” characters are treated as comments and are ignored. Thus these two classes need not to be modified for input of any ASCII files of that type. However, both the unpack procedure as specified in the event processor TYYYUnpackProc , and the unpack event class TYYYUnpackEvent, are depending on the column’s meanings here and must be adjusted. Additional information can be found in the README.txt file of the example package.
4.9 Example of analysis mesh
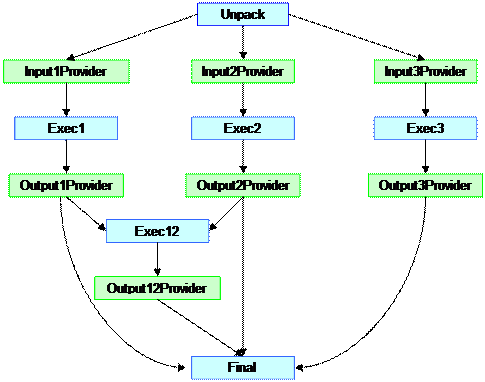
This example on Go4ExampleMesh shows how to set up a Go4 analysis of several steps that build a mesh of parallel analysis branches with different result generations. Additionally, one can see how the improved TGo4FileSource class supports partial input from a ROOT tree.
4.9.1 Structure:
The setup of the mesh analysis is done in the constructor of the TMeshAnalysis class. As in the Go4Example1Step, the general TGo4StepFactory is used to specify the event objects by name and class name. An overall of 13 analysis steps is defined for this example. Generally, the analysis mesh consists in two different kinds of steps, the execution steps and the provider steps. The unpack step, however, is as in the other examples just delivering sample data from a TGo4MbsSource (standard Go4 gauss example).
The step structure of the example mesh is as sketched in this figure (arrows show dataflow):
4.9.2 Execution steps:
These analysis steps do the actual analysis work, i.e. they convert some input event into the output event. This is the same as in the more simple examples (2-Step). However, to realize a mesh structure, the execution steps do not work directly on their own input event as assigned from the Go4 framework, but use the input event of one or more provider steps. The execution steps can access the input event pointers of any provider step by the provider step name, using the GetInputEvent("stepname") method. Note that the native input event of the execution steps is never used here (except for the very first "Unpack" step that processes the initial MBS event directly, without a provider step). There are no histogramming actions in the execution steps. To view the result data one has to use a dynamic list histogram or perform a TTree::Draw on the output event's tree, if existing.
4.9.3 Provider steps:
These analysis steps do not perform any analysis work at all, but only make sure that their own input event is always set correctly for the following execution steps, depending on the data flow situation. Generally, there are two cases:
- the provider step reads the input event directly from a branch of a ROOT tree (TGo4FileSource). In this case, the input event remains the native input event of this step as created in the step factory.
- the provider step refers to the result event of a previous execution step.
In this case, the provider processor itself has to find the correct event pointer by name from the Go4 object management. The default Go4 framework mechanism to handle these two cases will not suffice here, since it was designed for a subsequent order of steps and not for a mesh with parallel execution branches.
To do this job, all provider steps use the TMeshProviderProc class as general event processor, and the TMeshDummyEvent class as pseudo output event. The TMeshDummyEvent is necessary, because the Go4 framework will always call the Fill() method of the step's output event to execute any action of the step. So TMeshDummyEvent::Fill() calls method TGo4ProviderProc::SetRealInput() to set the pointer to the desired input event correctly.
If the input event is not read from file (native input event of this step), the provider processor has to search for it by name using the method TGo4Analysis::GetEventStructure("name"). However, the Go4 framework so far does not offer any additional parameter to specify the name of the appropriate input for a provider step. Therefore, this example uses the trick to derive the event name search string from the name of the provider processor itself: the name of this processor (up to the "_") is the name of the required event. Note that TGo4StepFactory forbids to use same names for different objects, since the object name is used as pointer name in the ProcessLine() call; therefore the processor name can not be identical with the input event name, but must differ by the "_" extension.
Additionally, the provider steps use the new partial input feature of the TGo4FileSource class (since Go4v2.9). The name of the event structure defines the name of the TTree branch that should be read from the input file. The first three provider steps use different parts of the TMeshRawEvent each. If the input event name is set to the name of the corresponding tree branch (e.g. "RawEvent.fxSub1"), the file source will only read this branch from the tree. If the input event name is set to the full name of the raw event ("RawEvent", commented out in this example), the complete event is streamed, including the not used parts. Note that in both cases the event object must consist in the full TMeshRawEvent, although in the partial input case only one sub-event is filled. This is required for a proper event reconstruction due to the ROOT TTree mechanism. In this example, the partial event input might increase the process speed by a factor of 2 compared to the full event input.
4.9.4 Configuration:
Although the step configuration can be defined as usual from the analysis configuration GUI, not all combinations of enabled and disabled steps make sense to process a subpart of the complete analysis mesh. For example, if execution step 2 shall be processed, the corresponding provider step for its input event has to be enabled, too. Note that the standard step consistency check of the Go4 framework is disabled here to run such a mesh at all (SetStepChecking(kFALSE)). So it is user responsibility to ensure that all required event objects are available for a certain setup. Moreover, with >13 analysis steps the standard analysis configuration GUI becomes quite inconvenient.
Therefore, the example uses a Go4 parameter TMeshParameter for the easy setup of the configuration. This parameter has just a set of boolean flags to determine which execution step shall be enabled. Depending on this setup, the UpdateFrom() method of the parameter also enables or disables the required provider steps. However, the parameter does not contain the full information of the input file names for the providers yet (In a "real" application, this could be implemented in a similar way though).
Thus the configuration procedure
looks like this. The TMeshParameter is edited on the GUI
to enable the desired execution steps. The parameter is send to analysis and
switches the steps on and off. Then the analysis configuration GUI has to be
refreshed by the user pressing button ![]() to view
the new setup. Here the user may change the names of the event sources for the
provider steps, if necessary. After submitting these settings again from the configuration
GUI, the mesh setup is ready. Note that once the mesh is configured in this
way, the configuration can be stored completely in the analysis preferences and
restored on the next startup.
to view
the new setup. Here the user may change the names of the event sources for the
provider steps, if necessary. After submitting these settings again from the configuration
GUI, the mesh setup is ready. Note that once the mesh is configured in this
way, the configuration can be stored completely in the analysis preferences and
restored on the next startup.
One could also think of a user defined GUI that handles both the setup of the TMeshParameter, and the rest of the analysis configuration in one window. This would offer the additional advantage that it could show the structure of the analysis mesh in a graphical way. However, such a user GUI is not delivered here, but can be created according to the hints given in package Go4UserGUI (see chapter 5.16, page 74).
4.9.5 Usage of the example:
One way to test the example could look like this:
§ Enable the first unpack step, disable the rest of the mesh. Use TGo4MbsRandom as event source for the Unpack and fill the output event TMeshRawEvent into a ROOT tree (switch on TGo4FileStore of unpack step). Do this until a reasonable number of events are processed.
§ Disable the unpack step, enable one or more of the subsequent execution steps. The input for the first 3 provider steps should be the ROOT file that was produced before. Note that the first providers could also read their sub-events from different files. Eventually, produce further output trees from the execution steps.
§ Change the setup in a way that only one branch of the mesh is processed, e.g. only Exec3 and Final.
§ Change the setup in a way that only a certain generation of events is processed, e.g. only Exec1, Exec2, and Exec3, writing output files of their results. Alternatively, let only Exec12 and Final work, reading their provider inputs from these output files.
§ Change the example code and recompile to add another execution branch, e.g. with new steps for InputProvider4, Exec4, OutputProvider4, and collect the results in the existing final step. New classes TMeshB4InputEvent, TMeshB4AnlProc, and TMeshB4OutputEvent should be defined for this (these can be derived from the corresponding classes as existing for the Exec3 branch).
§ Create a new mesh analysis from this template that matches your analysis structure.
5 How to Use the Go4 GUI
The GUI ist started from shell by command
go4
The following picture shows the GUI with all elements. On the right side you see the Go4 browser. The left side will be the display panel. Below is the Tree viewer, and under this the message window, the mbs monitor, and the analysis status display. With Show/Hide in the Settings one can configure the layout and save/restore it. All buttons in the top row are also available as pull down menus commands.
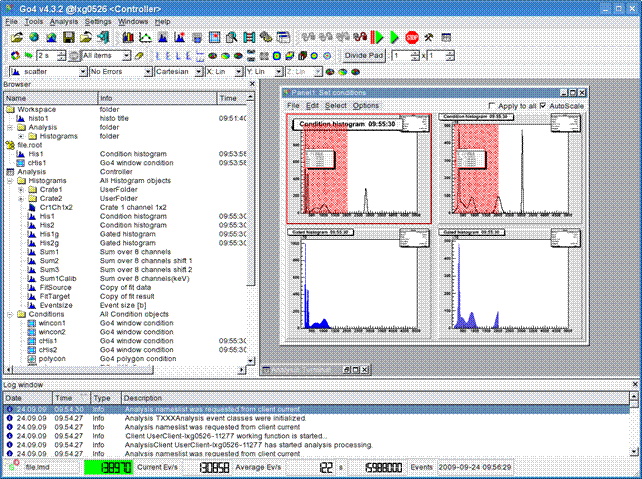
gui300
This would be the minimal look of a running analysis (the date is updated from the analysis):

There are many keyboard shortcuts to handle windows and actions. See chapter 11, page 90.
5.1 GUI menus
The icons in the
top line are grouped into three segments corresponding to the first three pull
down menus File, Tools, and Analysis.
5.1.1 File, Tools, Analysis menus
|
Pull down |
Icon |
Function |
|
File |
|
Open: opens local ROOT file |
|
|
|
Open Remote: open TNetFile, TWebFile or TRFIOFile to access remote data |
|
|
|
Connect DABC: open connection to DABC data socket (optional) |
|
|
|
Open HServer: open connection to gsi histogram server |
|
|
|
Save memory: save content of the memory browser into a ROOT file |
|
|
|
Close all files: close all ROOT files opened in file browser |
|
|
|
Exit: closes
window and exit from GUI |
|
Tools |
|
View Panel: creates window (canvas) to display histogram(s) |
|
|
|
Fit Panel: opens fit panel |
|
|
|
Histogram properties: opens window showing histogram properties |
|
|
|
Create
New His: opens histogram creation window |
|
|
|
Condition
properties: opens window showing conditions
properties |
|
|
|
Condition
Editor: opens central condition editor |
|
|
|
Event Printout: examine
current event contents |
|
|
|
Create Dyn.
List Entry: histogramming on the fly |
|
|
|
Load Libraries: opens tool to load ROOT libraries |
|
|
|
User GUI: starts user GUI |
|
Analysis |
|
Launch Analysis: starts up the analysis task (as client or server) |
|
|
|
Connect to Analysis: login to running analysis server |
|
|
|
Prepare
connection: allow
external analysis client connect to this gui |
|
|
|
Disconnect Analysis: remove connection without analysis server shutdown. |
|
|
|
Shutdown
Analysis server: in
administrator mode only! |
|
|
|
Set+Start: submit setting and start analysis |
|
|
|
Start: start analysis events loop (after setup and submit) |
|
|
|
Stop: stop analysis events loop |
|
|
|
Configuration: open the configuration windows |
|
|
|
Analysis Window: opens the output window of the analysis |
5.1.2 Help menu
The help menu provides to read several Go4 manuals on-line. Keyboard shortcut F1 will display the main user manual. Note that you need an external pdf viewer to be installed on your system to read them! Additionally, you can get version information about the Qt, ROOT and Go4 environment here, also available by pressing keys F2, F3, and F4, resp. If Go4 has been installed with DABC framework, this is also shown here.
gui357
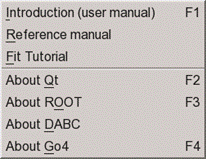
5.1.3 Settings menu
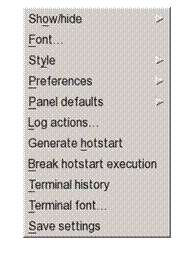 In the Settings pull down menu as
shown on the right side one can set different parameters
In the Settings pull down menu as
shown on the right side one can set different parameters
You can adjust all fields according your needs. Then Save Settings. The next start of the GUI will restore the saved layout. Note that settings also contain other preferences, like window geometry and tools visibility, view panel background color and crosshair mode, graphical marker appearance, connection setup parameters, etc. By default, the settings are stored in text files $HOME/.config/GSI/go4.conf (for detailed settings) and $PWD/.config/GSI/go4toolsrc (contains toolwindow layouts). To get the standard setup one may delete these two files. Note that since Qt 4.4 the QSettings are always in the home directory; however, the Go4 toolwindow settings may still be at a different location (usually in the current directory to provide different toolbar setups for different Go4 analyses).
Settings behavior can be changed using environment variable GO4SETTINGS. If this is set, the GUI toolwindow preferences are used from directory $GO4SETTINGS. If GO4SETTINGS contains keyword ACCOUNT, the Go4 toolwindow settings at $HOME/.config/GSI/go4toolsrc are used (like the other QSettings).
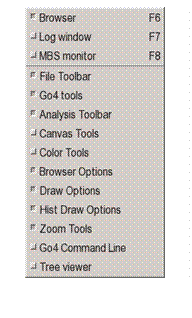 With the Show/hide entry of the settings menu (or with RMB in an empty menu region) one
gets the submenu on the right to select which tools shall be visible. The actual
content of these windows is preserved even if they are not displayed. This is
also available as popup menu when clicking the right mouse button on an empty
field of the main window.
With the Show/hide entry of the settings menu (or with RMB in an empty menu region) one
gets the submenu on the right to select which tools shall be visible. The actual
content of these windows is preserved even if they are not displayed. This is
also available as popup menu when clicking the right mouse button on an empty
field of the main window.
Keyboard shortcuts F6, F7, and F8 may toggle visibility of Browser, Log window and MBS monitor tools, resp. Shortcut F8 will toggle optional DABC monitor tool.
Fonts and Style of the Go4 GUI can be selected from the available ones after clicking the corresponding menu entries.
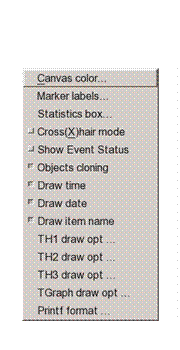 Preferences
specifies when objects are fetched automatically from analysis to the GUI
cache: each time when drawing object into a view panel, each time when copying object to local workspace, or each time when
saving local objects to file. All or none of the
above may be selected. Note that refreshing the local view manually or in
monitoring mode is not affected by these settings. Option Hide TGo4EventElement toggles if the Go4 Tree viewer may hide, or show all leaves which
belong to such event base class. Option Draw
item once enforces that each object is displayed
uniquely in one view panel only, so double clicking the same item again will
not draw it in a new pad, but will activate its existing view panel display.
Preferences
specifies when objects are fetched automatically from analysis to the GUI
cache: each time when drawing object into a view panel, each time when copying object to local workspace, or each time when
saving local objects to file. All or none of the
above may be selected. Note that refreshing the local view manually or in
monitoring mode is not affected by these settings. Option Hide TGo4EventElement toggles if the Go4 Tree viewer may hide, or show all leaves which
belong to such event base class. Option Draw
item once enforces that each object is displayed
uniquely in one view panel only, so double clicking the same item again will
not draw it in a new pad, but will activate its existing view panel display.
Panel defaults allow to set the default view panel layout.
In Panel defaults►Canvas color menu the default background color for all newly opened view panels can be set. This color may be saved together with the other settings. Panel defaults►Statistics box defines default fields in ROOT histogram statistics, Panel defaults►Marker labels specifies the default label layout (see next figures).
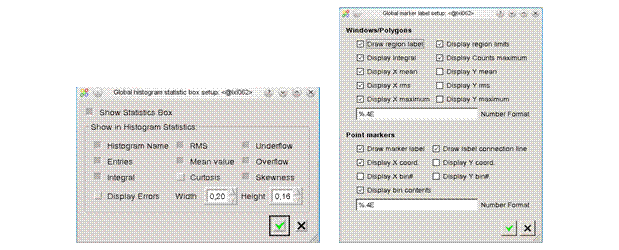 The
Crosshair mode entry toggles the default crosshair cursor on/off for all newly
opened view panels. This crosshair state may be saved together with the other
settings. However, the crosshair can be switched independently for each pad in
the menu of the view panel (see chapter 5.7, page
53).
Similarly, view panel display options Draw
Time, Draw Date, Draw item name, and edit mode Show event
status can be set to defaults here. Moreover,
default ROOT draw options for TH1, TH2, TH3 histograms and TGraph can be specified as string of keywords when selecting these menu
entries. Finally, Printf
format allows set a format string in printf style
controlling the printed range and accuracy for all float values in the
histogram statistic box.
The
Crosshair mode entry toggles the default crosshair cursor on/off for all newly
opened view panels. This crosshair state may be saved together with the other
settings. However, the crosshair can be switched independently for each pad in
the menu of the view panel (see chapter 5.7, page
53).
Similarly, view panel display options Draw
Time, Draw Date, Draw item name, and edit mode Show event
status can be set to defaults here. Moreover,
default ROOT draw options for TH1, TH2, TH3 histograms and TGraph can be specified as string of keywords when selecting these menu
entries. Finally, Printf
format allows set a format string in printf style
controlling the printed range and accuracy for all float values in the
histogram statistic box.
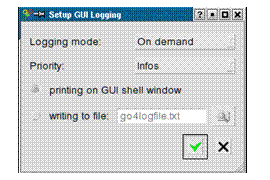 The Log actions of the GUI can be defined in a setup window from the settings menu.
By default, the log output (e.g. condition properties, histogram information)
is printed into the shell window where the GUI was started from. Additionally,
a text file may be specified for output. Logging
mode specifies if log output is produced On demand only
(i.e. on clicking the log button
The Log actions of the GUI can be defined in a setup window from the settings menu.
By default, the log output (e.g. condition properties, histogram information)
is printed into the shell window where the GUI was started from. Additionally,
a text file may be specified for output. Logging
mode specifies if log output is produced On demand only
(i.e. on clicking the log button ![]() when available), or Automatic
whenever the content of an editor/information window changes. Priority defines
the level of output suppression: Errors, Warnings,
Infos, or
Debugs. Level Errors will only log in case of an error, Debugs will printout even debug information of the Go4 kernel. This
reflects the priority of the TGo4Log::Message() method.
when available), or Automatic
whenever the content of an editor/information window changes. Priority defines
the level of output suppression: Errors, Warnings,
Infos, or
Debugs. Level Errors will only log in case of an error, Debugs will printout even debug information of the Go4 kernel. This
reflects the priority of the TGo4Log::Message() method.
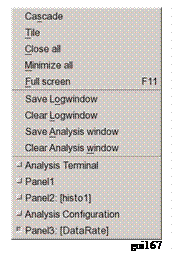 The Generate hotstart entry will save the current state of the GUI (window geometry,
objects in memory and monitoring list, objects in view panel, analysis
settings) to a Go4 hot start file (*.hotstart). The name of the hot start
file can be defined in file dialog here. When re-starting the Go4, the hot start
file may be used as command line argument, restoring the state of GUI and
analysis (see chapter 5.15, page
74).
The Generate hotstart entry will save the current state of the GUI (window geometry,
objects in memory and monitoring list, objects in view panel, analysis
settings) to a Go4 hot start file (*.hotstart). The name of the hot start
file can be defined in file dialog here. When re-starting the Go4, the hot start
file may be used as command line argument, restoring the state of GUI and
analysis (see chapter 5.15, page
74).
With Terminal history the buffer size for the analysis output window can be limited.
5.1.4 Windows menu
The Windows pull down menu shown on the right side provides items to arrange the windows and to save and clear the analysis and log windows. Cascade will arrange all windows of the Go4 workspace in a cascading manner, Tile will fill the Go4 workspace uniformly with all active windows resized as tiles. Close all will close, Minimize all will iconify all workspace windows. Selecting Full screen or keyboard shortcut F11 will expand the Go4 main window to full size, or collapse it to the previous size when selecting it a second time.
Save Logwindow and Clear Logwindow allow to save the contents of the log window to a text file, and to clear the log entries, resp. Similarly, Save Analysis window will store the text output of the analysis to file, and Clear Analysis window will erase it.
Finally the Windows menu contains a list of all windows in the Go4 workspace by their title. Selecting an entry in this list will activate the corresponding window and pop it to the front.
5.2 Load libraries to GUI
To access data from user defined classes (like parameters or events) a library including the ROOT dictionary is required. This library is produced by the make file and has the name libGo4UserAnalysis.so. It is recommended to load user libraries for non-Go4 classes (for instance, user event classes) before opening a file with a TTree, where object of these classes are stored. There are three different ways to do it.
First, any external shared library (with or without ROOT dictionary
inside) can be loaded by press of the ![]() button on the main window. A file dialog then
asks to specify the library to be loaded.
button on the main window. A file dialog then
asks to specify the library to be loaded.
Second, set the environment variable GO4USERLIBRARY to a list of user libraries (separated by colons) to be loaded when the GUI starts. Typically before run the Go4 GUI the user should type in the shell:
export GO4USERLIBRARY=..../libGo4UserAnalysis.so:..../libOther.so
Third, the new possibility (since ROOT 4.00/08) for automatic load of libraries with a .rootmap file. This file contains information to automatically load all necessary libraries for user classes. All make files of the Go4 examples generate .rootmap files during compilation. To explicitly generate this file again, type make map after compilation. If this file is located in the current directory (where GUI is started) or in the user home directory, all libraries will be loaded automatically at the time when required. For more details about .rootmap files see the ROOT home page.
5.3 Launch analysis
Press the ![]() button (or Alt a n or Strg n). This will start the Launch analysis
window to execute the analysis task on another host. The operation mode of the
analysis task may be “As client” (default), or “As server”; this has to be
specified in the selection box on top of the Start Anaylsis window.
button (or Alt a n or Strg n). This will start the Launch analysis
window to execute the analysis task on another host. The operation mode of the
analysis task may be “As client” (default), or “As server”; this has to be
specified in the selection box on top of the Start Anaylsis window.
The difference of these modes is that in client mode the analysis connects as client to the starting GUI and will be finished when the Go4 GUI terminates. There can be only one GUI connected to an analysis in client mode. The starting GUI will connect automatically to the analysis client after launching it with full controller priviliges.
In contrast to this, the analysis started “as server” will be an external process independent of the starting GUI. Therefore in server mode the analysis can not run embedded into the Qt Window of the GUI. Any number of Go4 GUIs may connect to this analysis server with different priviliges, but only one GUI may be the authorized controller. Especially the starting GUI has to login to the analysis server after launching it in a separate dialog window.
5.3.1 Launch analysis task in client mode
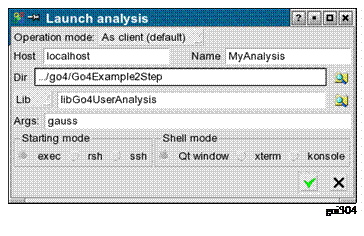 Besides the selection of the operation mode, the popup window
expects an arbitrary name for the analysis and the node name of the machine
where the client should be started. Normally this is the current node (localhost)
as offered by default. Furthermore there are fields for the user working directory
(in this directory the analysis is started) and the analysis file (library or
executable) name . Note that these values are stored to, and retrieved from
the current Go4 settings file. Start the analysis with button Start or RET.
Besides the selection of the operation mode, the popup window
expects an arbitrary name for the analysis and the node name of the machine
where the client should be started. Normally this is the current node (localhost)
as offered by default. Furthermore there are fields for the user working directory
(in this directory the analysis is started) and the analysis file (library or
executable) name . Note that these values are stored to, and retrieved from
the current Go4 settings file. Start the analysis with button Start or RET.
The client will be started in local process (starting mode: exec), in a remote shell (mode: rsh), or secure shell (mode: ssh). The analysis output is directed to a text window inside the GUI (“Qt window”), or to an external xterm, or to the KDE konsole (if existing), depending on the selected Shell mode. Individual configurations for starting and shell mode are stored in $GO4SYS/etc/go4.prefs file and can be adjusted there.
After initialization the client connects to the GUI. When this procedure is done, the message "Starting analysis client ...Please wait” changes to "Editing Analysis Configuration …" and the GUI is ready, popping up an analysis terminal window and the analysis configuration window. Here the analysis steps can be configured (see chapter 5.4, page 41). Then the analysis must be set up by pressing Submit (or Alt u).
After setting up the analysis it is started by ![]() (or Alt a s or Strg s).
In the browser the directory of the remote Analysis appears. The next figure
shows the GUI with a running analysis. On the right side is the browser with the
analysis directories; on the left side the analysis terminal, and the analysis
configuration window.
(or Alt a s or Strg s).
In the browser the directory of the remote Analysis appears. The next figure
shows the GUI with a running analysis. On the right side is the browser with the
analysis directories; on the left side the analysis terminal, and the analysis
configuration window.
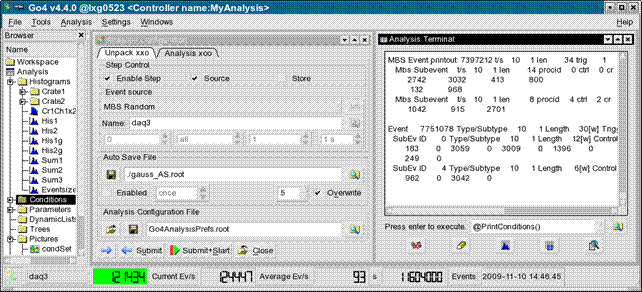
gui305
The configuration window is described in more detail in the next chapters.
5.3.2 Launch analysis task in server mode
To launch the analysis in server mode, the Operation mode in the start dialog window must be switched to “as server”. The other settings are the same as described in section 5.3.1, except for the disabled possibility to run the analysis shell in the internal Qt window of the GUI. Immidiately after starting the analysis server, the Connect to analysis server dialog will pop up, expecting specifications for login of the GUI to the newly created server.
5.3.3 Connect to existing analysis server
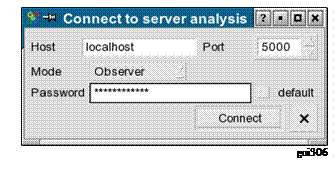 Once the analysis server has been started (from the start dialog,
from other GUI, or from external shell command line, respectively), the Go4 GUI
can connect to the server. This is done via the “Connect server” dialog that is
available from the connect button
Once the analysis server has been started (from the start dialog,
from other GUI, or from external shell command line, respectively), the Go4 GUI
can connect to the server. This is done via the “Connect server” dialog that is
available from the connect button ![]() in the analysis menu. If the server has been
launched before from this GUI, the connect dialog will popup automatically.
in the analysis menu. If the server has been
launched before from this GUI, the connect dialog will popup automatically.
Port number must match the connection port as printed out in server terminal window. Host should specify the node name of the server machine.
Three different accounts (roles) for login are provided: Observer, Controller, and Administrator. Each login has to be verified by a password. The Go4 default passwords go4view (observer), go4ctrl (controller), and go4super (administrator) are used when the default check box near the Password field is active.
These passwords may be changed in user analysis class by method DefineServerPasswords(const char* admin, const char* controller, const char* observer) with the arguments specifying the new password for the appropriate role. In this case, the correct password must be typed into the password field. See code examples (as comments) in Go4Example1Step and Go4ExampleAdvanced.
Only one controller or administrator may be logged in at the analysis server at the same time. If a controller (or administrator) GUI has already been attached, the next controller or administrator login will get an observer role. Observers may only view analysis objects and configuration, but may not modify them. Submit, Start and Stop, and remote macro execution is forbidden for observers, too. The controller account may modify all objects and the analysis setup and change the analysis running state, but may not shutdown the analysis server itself. Finally, only the administrator account may terminate the analysis server. After connection is established, the GUI main window title will show the role (Observer , Controller, Administrator).
After connection a controller can change and submit new the
configurations. When connected as an observer, button ![]() may be used to get the object list from the
analysis in the browser. One can also get the configuration, but cannot submit
them.
may be used to get the object list from the
analysis in the browser. One can also get the configuration, but cannot submit
them.
The GUI disconnects from the analysis by ![]() , but
the analysis continues to run. To really shut down the analysis one has to use
button
, but
the analysis continues to run. To really shut down the analysis one has to use
button ![]() (administrator only).
(administrator only).
No additional code should be implemented by the user to let analyses work as analysis server. All necessary job is done by standard go4analysis executable. It is recommended to convert older analysis code to new launch scheme – mainly remove main executable and provide several initialization routines as it done in examples. To run analysis as server from shell, one should call “go4analysis –server <name>”. The usage can be seen in any go4 example packages.
For analysis servers in ROOT macros see chapter 6, page 76
5.4 Analysis controls
5.4.1 Configuration window
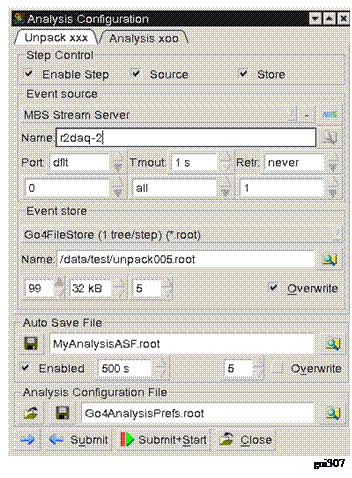 The Analysis configuration window shows the last valid setup of the
analysis steps. These are taken from the user analysis constructor parameters,
or from the ROOT file Go4AnalysisPrefs.root (in analysis working directory), if existing.
The Analysis configuration window shows the last valid setup of the
analysis steps. These are taken from the user analysis constructor parameters,
or from the ROOT file Go4AnalysisPrefs.root (in analysis working directory), if existing.
The Analysis configuration consists of the configuration parameters for each analysis step. The analysis steps are shown in different tabs of the configuration window. The values for event source, event store and working status of the analysis steps can be changed for each step separately. Depending on the chosen Event Source, relevant parameter fields will highlight for optional parameters. The MBS File, e.g., can specify an MBS tag file name (see MBS manual), and numbers for the first event, the last event and the event number step between subsequent events to be processed. Multiple input metafiles are supported by a preceding @ character (see chapter 5.4.5, page 43). The Event Source Remote Event Server needs a Port number, Event Server and Stream Server can either use the default MBS ports (“dflt”) or may specify another port number (when reading data from DABC). Additionally, for the on-line sources one can set a socket timeout Tmout in seconds and define the number of reconnection retry attempts Retr. The latter is useful if the DAQ must be restarted, so Go4 will automatically reconnect and continue once the data server is available, without submitting the settings again. For user defined sources (see chapter 5.4.6, page 43), the optional string argument Args may be evaluated in the user step factory.
The Event Store settings define the ROOT split
level and branch buffer size of the ROOT
tree, and the file compression
level. If the Overwrite radio button is false, new events will be appended to a previously
written tree of the same event store name.
Moreover, steps may be disabled completely: the first step, e.g., can be left out and the second step may read its input from a previously created output file of the first step. Note: the input of the actual first step must be specified; otherwise the analysis will not be initialized!
The auto-save file for analysis objects (histograms, conditions, parameters, dynamic list connections) is defined for all steps with the auto-save interval, the file compression level, and the Overwrite option. Selecting once for the auto-save interval will prevent saving the objects during the analysis run. However, the auto-save file will be written once at the analysis shutdown (when pressing Submit for the next settings, or Close, resp.). Auto-saving can be disabled completely by unchecking the ENABLED checkbox, i.e. the auto-save file is not even opened for reading previous objects.
Note that the ![]() buttons at the different name fields will open
a browser for the local file system to search for appropriate file names.
buttons at the different name fields will open
a browser for the local file system to search for appropriate file names.
The new settings are activated on the analysis client by pressing
the ![]() Submit button (or Alt u). Note:
you have to press Submit even if you
want to apply the settings unchanged!
To synchronize the configuration window with the current analysis
settings, the refresh button
Submit button (or Alt u). Note:
you have to press Submit even if you
want to apply the settings unchanged!
To synchronize the configuration window with the current analysis
settings, the refresh button ![]() can be used. This is usually done
automatically on first connection of the analysis, but it might be useful when
starting the analysis manually from a different shell, or when changing the
analysis setup independently from the GUI. For convenience, the
can be used. This is usually done
automatically on first connection of the analysis, but it might be useful when
starting the analysis manually from a different shell, or when changing the
analysis setup independently from the GUI. For convenience, the ![]() Submit+Start button
will submit the new settings and start the analysis loop immediately.
Submit+Start button
will submit the new settings and start the analysis loop immediately.
The Submit button closes the previous
analysis (i.e. all files and connections will be closed, all event classes
except for the analysis step factories will be deleted) and initializes the
analysis with the new settings. The ![]() Close button (or Alt C) will close
down the analysis without initializing a new setup. The analysis process,
however, will remain with all registered objects (histograms, conditions, etc.)
available.
Close button (or Alt C) will close
down the analysis without initializing a new setup. The analysis process,
however, will remain with all registered objects (histograms, conditions, etc.)
available.
To have the changed settings available on the next analysis client
startup, press the Save Button ![]() . This
will write the current analysis settings to the file Go4AnalysisPrefs.root
(default name for startup), or to any other ROOT file specified in the file
dialog or the filename text field. Previously written configurations can be
loaded using the Load button
. This
will write the current analysis settings to the file Go4AnalysisPrefs.root
(default name for startup), or to any other ROOT file specified in the file
dialog or the filename text field. Previously written configurations can be
loaded using the Load button ![]() and the corresponding file dialog.
and the corresponding file dialog.
· Note 1: A changed configuration must first be submitted to the analysis before it can be saved.
· Note 2: When a new configuration is loaded, the previously active analysis is closed without saving the configuration. After loading a configuration it appears in the configuration window. To initialize the analysis with these new settings, the submit button must be pressed!
5.4.2 Analysis terminal window
When using the Qt Window option in the launch window, the analysis terminal window of the GUI shows all analysis printouts
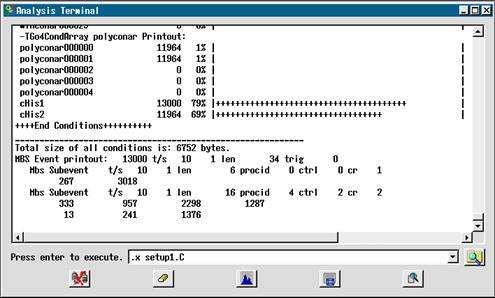
gui133
Button ![]() clears
the window,
clears
the window, ![]() prints all histograms info,
prints all histograms info, ![]() prints all conditions info (make window wide
enough for the counter bars). Button
prints all conditions info (make window wide
enough for the counter bars). Button ![]() will
open the event information window (see chapter 5.14, page
73).
will
open the event information window (see chapter 5.14, page
73).
Additionally, it is possible to kill the analysis process with the ![]() button on the hard way. This will disconnect
the analysis client after a while from the GUI and analysis can be launched
again. However, this is not recommended since the ROOT output files may remain
in a non valid state after the kill!
button on the hard way. This will disconnect
the analysis client after a while from the GUI and analysis can be launched
again. However, this is not recommended since the ROOT output files may remain
in a non valid state after the kill!
 Analysis terminal output can be stored by Windows►Save Analysis window menu command to text file. Analysis terminal output history is limited
by 100 Kbytes. This value can be changed in Settings►Terminal history menu command. To keep full history, 0 should be set.
Analysis terminal output can be stored by Windows►Save Analysis window menu command to text file. Analysis terminal output history is limited
by 100 Kbytes. This value can be changed in Settings►Terminal history menu command. To keep full history, 0 should be set.
When the analysis task is running in an external shell (xterm, konsole), the buttons and macro execution line will appear in a special dockwindow (see figure).
5.4.3 Macro execution in the analysis
The analysis terminal window offers the possibility to execute ROOT
CINT commands and macros in the analysis task. Note that a history of previous
commands of the session is available with the macro line combo box (mouse
selection, or arrow down key). ![]() looks up for macro files.
looks up for macro files.
Using the go4 pointer (already set to TGo4Analysis::Instance() ), one has access to all public methods of the analysis framework from inside the macro. Note that the shortcut @ exists here for TGo4Analysis::Instance()->, e.g. @PrintHistograms(“Cr1*”) will print all histograms with names matching the wildcard expression. In macros the environment variable __GO4ANAMACRO__ is defined and may be checked. A detailed description can be found in the reference manual.
It is not necessary to load the Go4 libraries in the macro again, since these are known at runtime in the analysis anyway.
See also macro execution in GUI (see 5.17, page 75). $GO4SYS/macros directory should be added to entry Unix.*.Root.MacroPath in .rootrc setup file.
5.4.4 Auto-save file mechanism
When auto-save is enabled (in
MainUserAnalysis), all objects are saved into a ROOT file after every auto-save
interval seconds time, and before termination. The auto-save file can also be
written on demand by Save button ![]() in the configuration window. At startup of the
analysis the following actions are done:
in the configuration window. At startup of the
analysis the following actions are done:
1. The analysis is created.
2. The auto-save file is read and all objects are restored from that file. Objects already existing, i.e. created in the analysis constructor, are overwritten by the objects from the auto-save file, except histograms. Existing histograms are not restored!
3. Before creating objects in the processor constructor or the PreLoop() method of the analysis one should check by the proper getter method if the object has been already restored from auto-save. If not, it can be created. If it is created while already existing the existing object is deleted first, i.e. the values from auto-save are lost.
When the analysis is controlled from GUI, objects are loaded from auto-save file when the Submit button is pressed (full sequence see chapter 3.6.11, page 20)
5.4.5 Multiple input files
There is the possibility to process multiple input files (source type MbsFile) in one analysis set-up. This can be achieved by wildcard characters in the Event Source name field, e.g. *.lmd or data???_march03.lmd or *. All files matching the wildcard expression will be read subsequently without closing the analysis; output events may be written into one event store. Additionally, one may specify the name of a metafile containing a list of inputs; the metafile name has to be preceded by an @, e.g. @gaussfiles.lml. Each line of the definition file gaussfiles.lml may contain the following format (values separated by blank spaces):
inputfile tagfile firstevent
lastevent skipevents
The numbers of first and last event always refer to the running event count in the currently open event source, starting with number 1 each (not the event number inside the event header). The skip events number defines how many events shall be skipped in one file in between two processed events; this may be useful if a long term sample of a large input file shall be taken. The tag file may contain information which events shall be processed in the input file (see MBS manual).
At least the input file name must be specified; wildcards are not allowed here. Complete lines in the metafile may be commented out by a preceding “!” or “#” character.
Moreover, metafile lines preceded by an @ character are treated as ROOTCINT commands, e.g.
@ .x setup.C
@ TGo4Analysis::Instance()->ShowEvent(“Unpack”); .
These commands are executed in between change of event source, thus allowing to use different setup parameters for different list-mode files.
Note that multiple input files also work in batch mode. However, wildcard expressions must be put in parentheses (“”) if they are passed to the MainUserAnalysis or go4analysis as command line parameter. In batch mode the input file suffix is automatically expanded to *.lmd, if it was neither .lmd nor .lml. Therefore the meta file can also have suffix .lmd, i.e. @myfiles results in reading myfiles.lmd (although it is a plain text file). A better way is to use suffix .lml, because then one can omit the @.
5.4.6 User defined event sources
Besides the delivered Go4 event sources for the standard MBS or ROOT file input, there is the possibility to define any other event source. In the analysis configuration window, there is the selection UserSource for the analysis step Event Source type. In this case, a TGo4UserSourceParameter object is passed to the step factory of the step. The user source name, and optionally, port number and a text argument can be specified in the configuration GUI to be evaluated on analysis initialization. An example of an analyis with a user defined event source is provided in directory Go4ExampleUserSource of the Go4 distribution. Please see section 4.8, page 31 for further details how to implement a user defined event source.
5.4.7 MBS status monitor
When working
with the gsi multi branch system mbs as event source, Go4 offers a monitoring
tool that can request information from the status port of a running mbs system.
This is available as dockwindow from the “Settings/ Show/hide” menu, or will
appear when the mbs button ![]() is pressed in the analysis configuration
window.
is pressed in the analysis configuration
window.
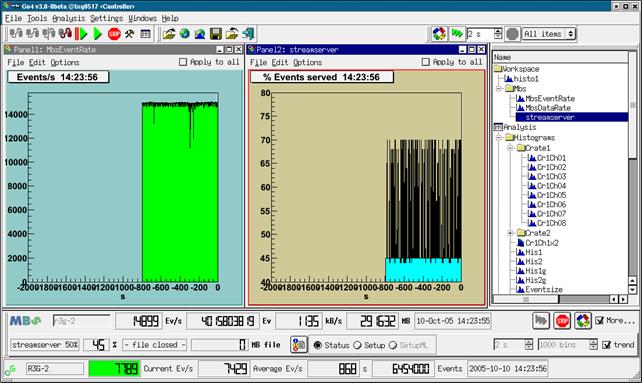
gui327b
The screenshot shows the Go4 main window with the mbs monitor tool docked in the bottom part, right above the Go4 analysis status line. The mbs monitor by default shows just one line of information, but may be extended by the lower line with more details using the More... checkbox.
The upper line
displays, from left to right: The mbs logo ![]() which is animated when the mbs acquisition is
running; a text line to edit the mbs host name; event rate (events/s); total
events acquired; data rate (kB/s); total data acquired (Mb); time and date of
last refresh. On the right there are control buttons: With
which is animated when the mbs acquisition is
running; a text line to edit the mbs host name; event rate (events/s); total
events acquired; data rate (kB/s); total data acquired (Mb); time and date of
last refresh. On the right there are control buttons: With ![]() the mbs
status server is newly connected and the information is refreshed. It is
possible to refresh the status frequently, this is switched on and off with the
buttons
the mbs
status server is newly connected and the information is refreshed. It is
possible to refresh the status frequently, this is switched on and off with the
buttons ![]() and
and ![]() ,
respectively. The refresh time can be chosen by the “seconds” spinbox in the lower
line of the mbs monitor window.
,
respectively. The refresh time can be chosen by the “seconds” spinbox in the lower
line of the mbs monitor window.
Additionally,
the lower line displays (from left to right): Name of data server in use
(streamserver, or eventserver) and percentage of delivered events 1/n, as it is
set in the mbs by command set
stream n, or set event n; percentage of real delivered events from this data
server; name of the file which is currently written by the mbs, if existing,
and total amount of data written to file since mbs startup. The ![]() button may be used to print the complete mbs
status structure, the complete setup structure, or the multilayer setup
structure, respectively, to the shell from which the gui was started. This is
selected by the radiobuttons Status, Setup, and SetupML. Note that printout of multilayer setup is enabled only if a real
multilayer setup exists in the observed mbs.
button may be used to print the complete mbs
status structure, the complete setup structure, or the multilayer setup
structure, respectively, to the shell from which the gui was started. This is
selected by the radiobuttons Status, Setup, and SetupML. Note that printout of multilayer setup is enabled only if a real
multilayer setup exists in the observed mbs.
Besides the time
selector for the monitoring frequency, the right side of the second line offers
the possibility to switch on several trending
histograms. This is done by the trend checkbox. The overall number of bins may be changed in the bins
selector; the range of one histogram bin equals the monitoring frequency. Note
that trending histograms are only written if the mbs status monitoring is
turned on (i.e. no new entry in trend histogram by manual refresh using button ![]() ).
Three different trending histograms are currently produced: for the event rate,
the data rate, and the percentage of delivered events at the mbs data server
(streamserver or eventserver). They appear in the Go4 browser in the Workspace/Mbs
folder and may be observered in Go4 view panels. The screenshot shows the
trending histograms for event rate and streamserver event ratio.
).
Three different trending histograms are currently produced: for the event rate,
the data rate, and the percentage of delivered events at the mbs data server
(streamserver or eventserver). They appear in the Go4 browser in the Workspace/Mbs
folder and may be observered in Go4 view panels. The screenshot shows the
trending histograms for event rate and streamserver event ratio.
Note that a
warning sign ![]() will appear in the upper line if connection to
mbs status server fails.
will appear in the upper line if connection to
mbs status server fails.
5.4.8 DABC monitor
When working
with the new gsi DAQ framework DABC (Data Acquisition Backbone Core, see http://dabc.gsi.de)
as event source, Go4 offers a monitoring tool that can request info services
from the DIM server (Distributed Information Management, see http://dim.web.cern.ch/dim/) of the DABC
control system. It is available as dockwindow from the “Settings/ Show/hide”
menu. Note: this tool is available only
if Go4 installation was build with environment variable $DIMDIR set to the DIM
installation directory!
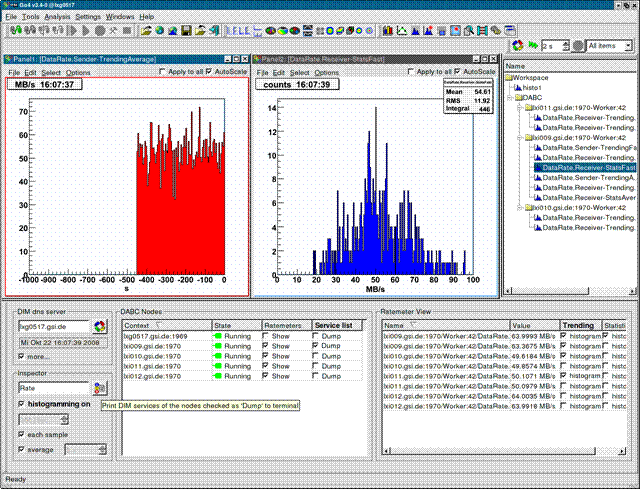
gui362
The picture
shows the Go4 main window with the DABC monitor tool at the bottom and some
histograms filled with monitored data. On the left side of the monitor tool
(frame DIM dns server) the hostname
which runs the DIM name server can be
specified. When pressing the ![]() button, the list of DIM services is refreshed
from the dns server. The time and date of the most recent refresh of any
requested DIMinfo appears in the text line below the dns server name. The more... checkbox allows to show or hide
the Inspector frame that contains
more controls (see below).
button, the list of DIM services is refreshed
from the dns server. The time and date of the most recent refresh of any
requested DIMinfo appears in the text line below the dns server name. The more... checkbox allows to show or hide
the Inspector frame that contains
more controls (see below).
Any node that exports a DABC state service will show up in the DABC Nodes list (table in the middle); the first column gives the XDAQ Context name in the form nodename:port, as specified in DABC setup. The current value of the DABC finite state machine (or the MBS acquisition status, resp.) is marked with its corresponding colour and name in the State column of the nodes table, e.g. “Running”.
By using the Show checkboxes in the Ratemeters column the user can select
to subscribe for all DABC rate parameters of the corresponding node. These
subscribed rate parameters will show up in the Ratemeter View list (table on the right). The first two columns of the
Ratemeter View list denote the full DIM parameter Name (unique for each DIM name server scope) and the current Value (in the units as published by the
DIM service, here Mb/s). The table information is refreshed by means of the DIM
mechanism whenever a rate service is
updated. Note that a warning sign ![]() and the number “-1”
will appear in the Value column if a previously known service variable is
currently not available. This may happen when DABC is switched into “Halted” state which will remove DABC modules
and their rate parameters.
and the number “-1”
will appear in the Value column if a previously known service variable is
currently not available. This may happen when DABC is switched into “Halted” state which will remove DABC modules
and their rate parameters.
The histogram checkboxes in the Trending and Statistics columns of the Ratemeter View table select which ratemeter values shall be filled into a trending or statistics histogram, resp. These histograms can be found in the “Workspace/DABC” folder of the Go4 browser, sorted into subfolders according their full context names. They can be displayed in a viewpanel, renamed, saved to a file, etc. like any other Go4 histogram (See chapters 5.5 and 5.7).
The histogramming is controlled by the Inspector frame (on the left). The histogramming on checkbox toggles the histogramming of the selected values on or off. Before turning on the histogramming, the user may chose the histogram binsize by means of the binsize spinbox. Note: when binsize is changed, all previous trending/statistics histograms will be replaced and lose their contents! If each sample is checked, there will be fast trending (or statistics, resp.) histograms which are filled at every update of the DIM service (usually in 1 s interval). If average is checked, there will be average trending (or statistics, resp.) histograms which are updated with the average of the values accumulated during a user defined time interval. This time interval is set by the spinbox next to the average checkbox (here 5 s). Both each sample and average histograms may be accumulated simultaneously; if neither each sample nor average is checked, there will be no histogramming.
Besides
observing the rate parameter values, it is possible to print the current values
of any DIM service exported on the DABC nodes. The Dump checkbox in the Service
list column of the DABC nodes
table selects a node for a full service list inspection. The ![]() button in the Inspector frame may then be used to print the current values of all
selected services to stdout of the shell from which the gui was started.
Moreover, it is possible to dump services only if their name contains a certain
text, or if it matches a shell-like wildcard expression. This filter expression
may be written into the text field near the
button in the Inspector frame may then be used to print the current values of all
selected services to stdout of the shell from which the gui was started.
Moreover, it is possible to dump services only if their name contains a certain
text, or if it matches a shell-like wildcard expression. This filter expression
may be written into the text field near the
![]() button before pressing it. In the screenshot
example shown in the figure, only parameters with names containing the string “Rate”
would be dumped.
button before pressing it. In the screenshot
example shown in the figure, only parameters with names containing the string “Rate”
would be dumped.
5.5 The Go4 browser
After pressing ![]() the analysis starts and the rates are
displayed at the bottom as shown in the screen shot below. The analysis output
window and the configuration window have been closed. A view panel created by
the analysis starts and the rates are
displayed at the bottom as shown in the screen shot below. The analysis output
window and the configuration window have been closed. A view panel created by ![]() has been opened and a histogram is displayed
by dragging & dropping a histogram from the browser into the canvas. Note
the logging window displaying messages from the remote analysis. This log panel
can be opened in the Settings menu
bar. The complete logging history may be saved into a text file by the Windows►Save Logwindow menu command.
has been opened and a histogram is displayed
by dragging & dropping a histogram from the browser into the canvas. Note
the logging window displaying messages from the remote analysis. This log panel
can be opened in the Settings menu
bar. The complete logging history may be saved into a text file by the Windows►Save Logwindow menu command.
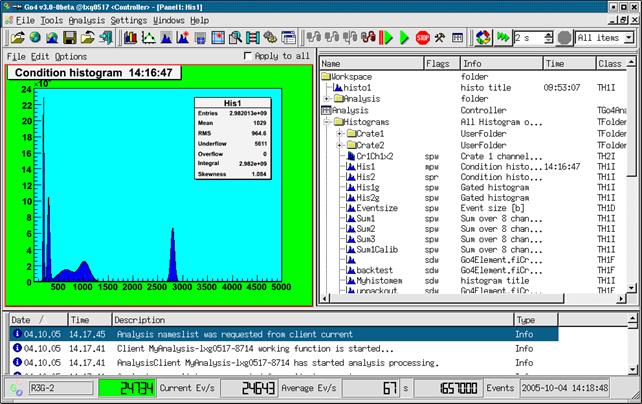
gui309
The Go4 browser on the right side shows objects from different data
locations in a folder structure. Remote objects in the connected analysis task
are listed under the Analysis branch. The Workspace folder
contains all objects that are put into the memory of the local GUI, e.g. by
creating fix copies of remote analysis objects. A root file opened from the
files toolbar with the ![]() button will appear in a folder of the
filename; similarly, a connection to a
remote data source like the xrootd, the root webfile, or the gsi histogram
server, shows up as separate browser branch.
button will appear in a folder of the
filename; similarly, a connection to a
remote data source like the xrootd, the root webfile, or the gsi histogram
server, shows up as separate browser branch.
5.5.1 Browser columns
 Beside the “names” column showing the objects in their folder
structure by symbols, the Go4 browser has configurable columns to display
different kinds of properties of the displayed objects: Flags, Info, Date,
Time, Class, and Size. These can be switched on and off by the menu that pops
up on right mouse button click in one of these. Moreover, the order of these
columns can be freely arranged in the browser by dragging and dropping their caption
to a new position.
Beside the “names” column showing the objects in their folder
structure by symbols, the Go4 browser has configurable columns to display
different kinds of properties of the displayed objects: Flags, Info, Date,
Time, Class, and Size. These can be switched on and off by the menu that pops
up on right mouse button click in one of these. Moreover, the order of these
columns can be freely arranged in the browser by dragging and dropping their caption
to a new position.
The Flags column will indicate certain properties of the object by letters:
· m - shall be monitored frequently; or s - is static until explicitely refreshed
· d - object may be deleted; or p - is protected against deletion
· r – read only, can not be reset; or w – writable, may be reset
The Info field will usually show the type of the folder, or the title of the ROOT object.
Date and Time columns show the date or time of the last object refresh to the GUI inernal cache (for remote data sources), or of the object creation (for local workspace), respectively.
Class column shows the class name, and Size will give an overall object size in bytes.
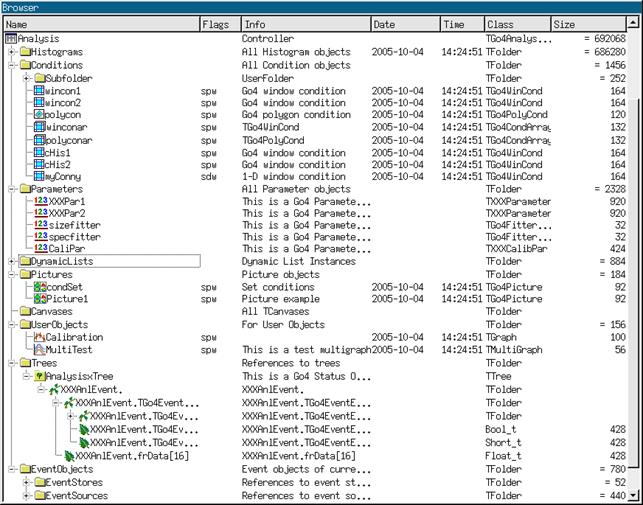 gui311
5.5.2 General functionality
 Each item in the browser has a context menu, which can be activated
by right mouse button click on that item. It is shown in the figure on the
right. By means of this menu, it is possible to operate on the browsed objects.
The items in the upper part of the context menu (above the line) are available
for all items, whereas the items in the lower part contain special functionality
to control remote data sources like the analysis.
Each item in the browser has a context menu, which can be activated
by right mouse button click on that item. It is shown in the figure on the
right. By means of this menu, it is possible to operate on the browsed objects.
The items in the upper part of the context menu (above the line) are available
for all items, whereas the items in the lower part contain special functionality
to control remote data sources like the analysis.
Histograms and pictures can be plotted either by double click, or by
drag and drop in a view panel, or by the right mouse menu. Item ![]() Plot draws each selected histogram into an own graphical pad,
Plot draws each selected histogram into an own graphical pad, ![]() Superimpose draws all selected histograms superimposed on one pad.
Superimpose draws all selected histograms superimposed on one pad.
The browser items represent the structure of a connected data source
like the remote analyis, but will only retrieve the objects on demand. This
happens usually just before the objects are drawn. To explicitely get the
objects into the local memory cache without drawing them, the ![]() Fetch
item(s) functionality may be used. Note that the
browser’s implicit fetching behaviour may be adjusted in the
Settings/Preferences menu by “Fetch when drawing”, and “Fetch when copying”.
Fetch
item(s) functionality may be used. Note that the
browser’s implicit fetching behaviour may be adjusted in the
Settings/Preferences menu by “Fetch when drawing”, and “Fetch when copying”.
The selected objects may be saved into a ROOT file with menu item ![]() Save
selected... The
Save
selected... The ![]() Export to... functionality will offer the possibility to export root histograms
to ascii or radware format.
Export to... functionality will offer the possibility to export root histograms
to ascii or radware format.
Item ![]() Info shows some information of the object,
Info shows some information of the object, ![]() Edit... opens the
editor if available. Item
Edit... opens the
editor if available. Item ![]() Delete Item deletes the selected objects from the local memory, whereas item
Delete Item deletes the selected objects from the local memory, whereas item ![]() Delete from
analysis will delete the corresponding object in
the remote analysis, if possible (see chapter 5.5.9. page
51).
Delete from
analysis will delete the corresponding object in
the remote analysis, if possible (see chapter 5.5.9. page
51).
5.5.3 Analysis folder controls
The Analysis folder shows the remote folder structure, which contains all
objects that were registered to the analysis client. At any time the list of
the remote objects may be refreshed by the right mouse button entry ![]() Refresh
nameslist. The folder Histograms e.g. contains the histograms, the folder Trees will show the structure of
all registered trees, e.g. all trees created by TGo4FileStores.
Refresh
nameslist. The folder Histograms e.g. contains the histograms, the folder Trees will show the structure of
all registered trees, e.g. all trees created by TGo4FileStores.
The eraser item ![]() Clear
(Reset to 0) clears the selected objects like histograms,
conditions, graphs and so on.
Clear
(Reset to 0) clears the selected objects like histograms,
conditions, graphs and so on.
Each object on the analysis has two protection modes – delete
protection and clear protection. These modes indicated in Flags column of
analysis browser (see below). Delete protection is set for an object when it is
created and added on the analysis side. It prevents deletion of such objects
from GUI. Objects created by GUI commands have no such protection and can be
deleted by the ![]() Delete from
analysis functionality. Clear protection prevents
the user to clear the content of objects by using
Delete from
analysis functionality. Clear protection prevents
the user to clear the content of objects by using ![]() . This
mode can be set and unset for any object via context menu commands Set clear protection
. This
mode can be set and unset for any object via context menu commands Set clear protection ![]() and Unset clear protection
and Unset clear protection
![]() , respectively.
, respectively.
5.5.4 The monitoring mode
In the Analysis a histogram, graph, or picture can be set into the monitoring mode
by selecting it and pressing the monitoring entry ![]() Monitor
item(s) in the right mouse menu. This is indicated
by the letter “m” in the Flags column of
the browser (static objects have letter “s”).
Monitoring means that the content of objects are updated continuously from the
remote data source (analysis, histogram server,..) to the GUI. This allows e.g.
to watch the filling process of a histogram. The monitoring property of an item
may be switched off by the
Monitor
item(s) in the right mouse menu. This is indicated
by the letter “m” in the Flags column of
the browser (static objects have letter “s”).
Monitoring means that the content of objects are updated continuously from the
remote data source (analysis, histogram server,..) to the GUI. This allows e.g.
to watch the filling process of a histogram. The monitoring property of an item
may be switched off by the ![]() Stop items
monitoring functionality of the context menu.
Stop items
monitoring functionality of the context menu.
Note that only the visible objects are frequently updated, i.e. even if a browser object is in monitoring state, it will not be copied from the remote data source if is not drawn in any view panel, or displayed in an editor, respectively.
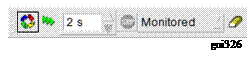 The overall monitoring action can be started with button
 ![]() of the Browser
options dock window. Here the update frequency may be specified in
seconds, too. Button
of the Browser
options dock window. Here the update frequency may be specified in
seconds, too. Button ![]() will cease monitoring of all monitored
objects, but will not change their monitoring property (flags). Additionally,
this dock window offers a button
will cease monitoring of all monitored
objects, but will not change their monitoring property (flags). Additionally,
this dock window offers a button ![]() for immediate refresh of all visible objects,
and a filter function for the browser to display either all objects, or only
the monitored objects, or only the currently fetched objects, respectively. The clear button
for immediate refresh of all visible objects,
and a filter function for the browser to display either all objects, or only
the monitored objects, or only the currently fetched objects, respectively. The clear button ![]() may be
used to clear (reset to 0) all remote objects at once (see section 5.5.9, page
51). When
the Browser options tool is active, the following keyboard shortcuts can be applied:
may be
used to clear (reset to 0) all remote objects at once (see section 5.5.9, page
51). When
the Browser options tool is active, the following keyboard shortcuts can be applied:
F5: Refresh
display of all remote histograms
Shift-C: Clear
all remote histograms remotely
Shift-M: Start
monitoring timer
Shift-N: Stop
monitoring timer
5.5.5 The workspace folder
The Workspace folder contains all objects that are put into the memory of the
local GUI. This may happen either by producing a new histogram from the ROOT
menus in the view panel, like a re-binning, or a projection, or from the Go4
tree viewer; or objects may be copied from elsewhere to the workspace. Item ![]() Copy to
Workspace will produce a copy of the current object
and put it into the workspace folder. This copy will preserve the subfolder
structure of the data source; if e.g. a histogram was copied from analysis folder
“Histograms/Crate1”, the copy will be placed in folder
“Workspace/Analysis/Histograms/Crate1”. The
Copy to
Workspace will produce a copy of the current object
and put it into the workspace folder. This copy will preserve the subfolder
structure of the data source; if e.g. a histogram was copied from analysis folder
“Histograms/Crate1”, the copy will be placed in folder
“Workspace/Analysis/Histograms/Crate1”. The ![]() Copy to
clipboard,
Copy to
clipboard, ![]() Paste from
clipboard, respectively, allow a standard
copy/paste functionality to any destination in the workspace. Additionally, in
the workspace folder the right mouse button menu offers the Create folder and
the
Paste from
clipboard, respectively, allow a standard
copy/paste functionality to any destination in the workspace. Additionally, in
the workspace folder the right mouse button menu offers the Create folder and
the ![]() Rename
object functionality, as known from general file
system browsers.
Rename
object functionality, as known from general file
system browsers.
5.5.6 Browsing files
ROOT files containing data can be opened (buttons ![]() and
and ![]() of the main window file menu, respectively) as
with the native ROOT TBrowser/TTreeViewer. Any ROOT file can be opened. Histograms in these files can be displayed
in the Go4 view panel like local objects. A ROOT tree in a local file can be
examined with the tree viewer of Go4. In contrast to the remote tree viewer
mode, trees in a local file are processed by the GUI itself and do not have an
effect on the remote analysis. The GUI knows if a tree viewer entry comes from
a remote, or from a local TTree, so the
of the main window file menu, respectively) as
with the native ROOT TBrowser/TTreeViewer. Any ROOT file can be opened. Histograms in these files can be displayed
in the Go4 view panel like local objects. A ROOT tree in a local file can be
examined with the tree viewer of Go4. In contrast to the remote tree viewer
mode, trees in a local file are processed by the GUI itself and do not have an
effect on the remote analysis. The GUI knows if a tree viewer entry comes from
a remote, or from a local TTree, so the ![]() button will either send a command to the
analysis client for a dynamic histogram, or will perform a local TTree::Draw() call.
button will either send a command to the
analysis client for a dynamic histogram, or will perform a local TTree::Draw() call.
If the file contains user
objects, make sure that the GUI has loaded the proper libraries to access them
(see chapter 5.2, page 37).
5.5.7 Resetting and deleting objects
Any object in the workspace may be deleted by selecting it and using
the popup menu delete item ![]() . Objects in the Analysis (histograms, conditions, parameters, …) that
were created in analysis code must not be deleted, for the
compiled user analysis would still try to access these objects after deletion.
Therefore, deleting these objects is disabled using the delete protection
property (symbol “p” in Flags browser). However, dynamic objects that
had been created from the gui (histograms, conditions, dynamic list
connections) are not delete protected and can be removed by the delete button.
. Objects in the Analysis (histograms, conditions, parameters, …) that
were created in analysis code must not be deleted, for the
compiled user analysis would still try to access these objects after deletion.
Therefore, deleting these objects is disabled using the delete protection
property (symbol “p” in Flags browser). However, dynamic objects that
had been created from the gui (histograms, conditions, dynamic list
connections) are not delete protected and can be removed by the delete button.
An analysis histogram can be reset (contents and statistic values to
zero) by selecting it and chosing the “![]() Clear”
entry in the browser’s right mouse button popup menu. Resetting an analysis TGraph object will erase all points of the curve. For parameters, the
method Clear() is
called which may be implemented by the user.
Clear”
entry in the browser’s right mouse button popup menu. Resetting an analysis TGraph object will erase all points of the curve. For parameters, the
method Clear() is
called which may be implemented by the user.
All objects within a folder are reset at once by selecting the
folder icon in the remote browser and chosing the ![]() entry of the right mouse button menu. This has
the same effect as calling method ClearObjects(“Foldername”) of TGo4Analysis. It is also
possible to select multiple objects in the browser and then apply the clear
menu. To clear all remote objects at
once, the clear button
entry of the right mouse button menu. This has
the same effect as calling method ClearObjects(“Foldername”) of TGo4Analysis. It is also
possible to select multiple objects in the browser and then apply the clear
menu. To clear all remote objects at
once, the clear button ![]() in the Browser
options dockwindow can be pressed.
in the Browser
options dockwindow can be pressed.
Note that any analysis object can be protected against clearing by a switch in the remote browser’s right mouse button context menu (See chapter 5.5.3).
5.5.8 Histogram server connection
 From the main window File menu
entry
From the main window File menu
entry ![]() one can connect to any GSI histogram server
like MBS, GOOSY, LeA, or another Go4 analysis. The parameters for the histogram
server, such as node name (Server), login name (Base), the socket Port number, the Password, and an optional Filter expression, are specified in a connection dialogue
window. After a successful connection the histograms of the server appear in
the Go4 browser in a folder named HServ_basename, if basename is the name of
the histogram server base.
one can connect to any GSI histogram server
like MBS, GOOSY, LeA, or another Go4 analysis. The parameters for the histogram
server, such as node name (Server), login name (Base), the socket Port number, the Password, and an optional Filter expression, are specified in a connection dialogue
window. After a successful connection the histograms of the server appear in
the Go4 browser in a folder named HServ_basename, if basename is the name of
the histogram server base.
5.5.9 DABC server connection
If Go4 has been installed together with the data acquisition framework
DABC, the main window File menu contains an additional entry ![]() that connects to the native command and data socket
channel of any DABC process. The DABC server is identified by a connection URL
of format dabc://nodename:port to be specified in a connection dialogue
window. After a successful connection the object hierarchy of DABC appears in
the Go4 browser under a folder named nodename:port,
e.g. lxg0538:1237. This allows displaying
and monitoring the ROOT objects that are known to such DABC node on the Go4
GUI.
that connects to the native command and data socket
channel of any DABC process. The DABC server is identified by a connection URL
of format dabc://nodename:port to be specified in a connection dialogue
window. After a successful connection the object hierarchy of DABC appears in
the Go4 browser under a folder named nodename:port,
e.g. lxg0538:1237. This allows displaying
and monitoring the ROOT objects that are known to such DABC node on the Go4
GUI.
5.6 The Go4 tree viewer
The Go4 tree viewer is started via Settings►Show/Hide►Tree viewer menu or via RMB pull down menu.
![]()
gui140
There are two operation modes for the Go4 tree viewer: the local mode, or the remote mode. Dragging and dropping the tree leaf names from file or remote browser, the tree viewer will switch automatically into the local or remote mode, respectively.
5.6.1 Local mode
The tree viewer works on a tree in a file that was opened in the browser.
This is like the original ROOT tree viewer, with the same logic of drag and
drop. However, the Go4 tree viewer supports the resolution of the Go4 composite
event information (see section 6, page
76). On
pressing button ![]() , the
local tree will be processed as defined by the given draw expressions in
, the
local tree will be processed as defined by the given draw expressions in ![]()
![]()
![]() (and optional
(and optional ![]() ) fields
of the Go4 tree viewer. The local histogram of the given name is filled with
the result. The histogram will appear in the memory tab and may be displayed in
a view panel. If no name is specified, an automatic name is chosen from the
given leaf names.
) fields
of the Go4 tree viewer. The local histogram of the given name is filled with
the result. The histogram will appear in the memory tab and may be displayed in
a view panel. If no name is specified, an automatic name is chosen from the
given leaf names.
All classes, which are stored in the tree, should be known to GUI. User should load appropriate libraries before using local tree viewer (see chapter 5.2, page 37).
5.6.2 Remote mode (dynamic list histogram)
The Analysis folder shows the structure of all objects registered to analysis trees
in the Trees subfolder. By drag and drop the elements of a tree can be put into
![]()
![]()
![]() fields of the Go4 tree viewer. A name and an
optional drawing condition can also be defined here. The logic is the same as
for the regular ROOT tree viewer. On pressing button
fields of the Go4 tree viewer. A name and an
optional drawing condition can also be defined here. The logic is the same as
for the regular ROOT tree viewer. On pressing button ![]() , this
information is passed to the analysis client and a new entry in the Go4 dynamic
list is created. After pressing
, this
information is passed to the analysis client and a new entry in the Go4 dynamic
list is created. After pressing ![]() in the Analysis panel, a new histogram of the
defined name appears in the histogram folder (if no name was defined in the
tree viewer, a default name is used combining the variable names). Note: the
histogram itself will be created no sooner than the next events after the
in the Analysis panel, a new histogram of the
defined name appears in the histogram folder (if no name was defined in the
tree viewer, a default name is used combining the variable names). Note: the
histogram itself will be created no sooner than the next events after the ![]() are processed, i.e. the analysis must be
running. This histogram will be filled event by event with the defined
parameters of the tree. Go4 internally uses a TTree::Draw() over a number of collected events to update the histogram contents.
This number, the dynamic list interval TreeDrawInterval, can be set by the analysis method SetDynListInterval(Ndyn), or can be changed in the dynamic list editor (see chapter 5.12, page
70).
are processed, i.e. the analysis must be
running. This histogram will be filled event by event with the defined
parameters of the tree. Go4 internally uses a TTree::Draw() over a number of collected events to update the histogram contents.
This number, the dynamic list interval TreeDrawInterval, can be set by the analysis method SetDynListInterval(Ndyn), or can be changed in the dynamic list editor (see chapter 5.12, page
70).
If the histogram specified in the tree viewer already exists when
the dynamic list entry is created, the histogram of that name will be filled by
the dynamic list instead of filling a new histogram. Therefore it is possible
to create a histogram with desired bin size first (see chapter 5.6.3, page
52), and
then assign this histogram to a new entry of the dynamic list. This can be done
easily by dragging and dropping a histogram icon from the histograms folder
into the histogram textbox of the tree viewer. Again, pressing ![]() will create the dynamic list entry; the given
histogram will then be filled every Ndyn events. The dynamic list
tree is kept in memory, if in the analysis configuration for output Go4BackStore had been selected.
will create the dynamic list entry; the given
histogram will then be filled every Ndyn events. The dynamic list
tree is kept in memory, if in the analysis configuration for output Go4BackStore had been selected.
A histogram filled by the dynamic list, like any other remote histogram,
can be displayed continuously in a view panel by switching on the Go4 monitoring
mode (see chapter 5.5.4, page 49).
5.6.3  Creating a new histogram
The button ![]() will popup the histogram creation window. Here
the properties of the histogram to be created anew can be specified
(dimensions, precision, binning, range, name, title). The histogram may be
either created in the local directory (Create Local), or created in the
remote analysis (Create Remote). A new local histogram will appear in the local objects panel, a
remote histogram is put under the histograms folder in the Go4 folder
structure. A new histogram (like any existing histogram) can be used as target
for the remote or local tree viewer. This is done by specifying the histogram
name in the tree viewer name field, or by dragging and dropping the histogram
icon to this name field. The tree viewer
will popup the histogram creation window. Here
the properties of the histogram to be created anew can be specified
(dimensions, precision, binning, range, name, title). The histogram may be
either created in the local directory (Create Local), or created in the
remote analysis (Create Remote). A new local histogram will appear in the local objects panel, a
remote histogram is put under the histograms folder in the Go4 folder
structure. A new histogram (like any existing histogram) can be used as target
for the remote or local tree viewer. This is done by specifying the histogram
name in the tree viewer name field, or by dragging and dropping the histogram
icon to this name field. The tree viewer ![]() will then fill the created histogram instead
of creating a new histogram with arbitrary binning and range settings.
will then fill the created histogram instead
of creating a new histogram with arbitrary binning and range settings.
5.7 The Go4 view-panel
Pressing ![]() in the Go4 main control window opens a new Go4
view panel. A new view panel will also pop up automatically when any object in
the browser is selected and the right mouse button menus
in the Go4 main control window opens a new Go4
view panel. A new view panel will also pop up automatically when any object in
the browser is selected and the right mouse button menus ![]() or
or ![]() are activated. Furthermore, objects can be
drawn by “drag and drop” from the Go4 Browser to an existing view panel pad and
displayed there. On the left side the optional ROOT graphical editor is
embedded. It is opened by
are activated. Furthermore, objects can be
drawn by “drag and drop” from the Go4 Browser to an existing view panel pad and
displayed there. On the left side the optional ROOT graphical editor is
embedded. It is opened by
Edit►Show ROOT attributes editor.
Select with left mouse an object on the canvas and the editor will change
accordingly.
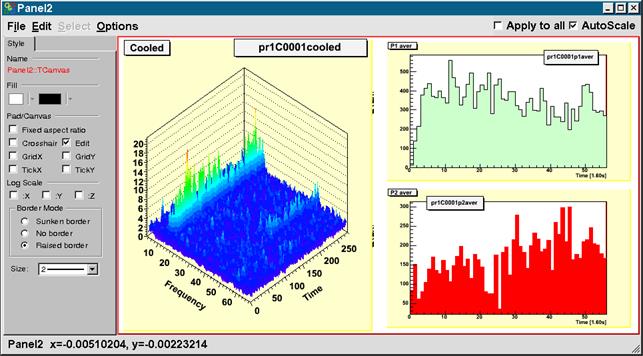
gui318
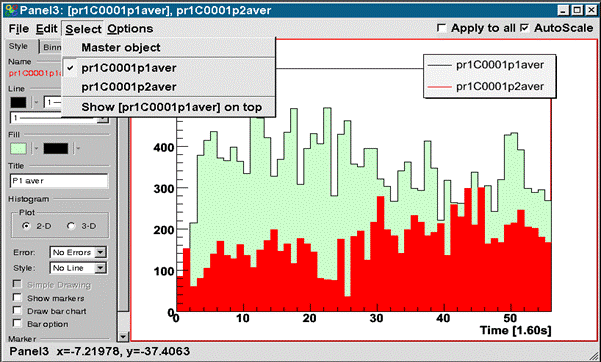 gui368
An existing view panel can be divided into independent sub-pads by the division buttons in the Canvas Tools activated with the RMB on an empty region. When several histograms in the browser are selected for plotting, the view panel division will be done automatically to display all histograms in one new view panel window.
The canvas embedded in the Go4 View panel is an ordinary ROOT canvas, offering all ROOT features of the mouse button actions on the displayed objects (e.g. opening a histogram fit panel, rescaling the axes using cursor and left mouse button, ...). The currently active sub-pad (indicated by a red frame) can be selected with the left, or with the middle mouse button (ROOT style), resp. Graphic style and range settings are always applied to the sub-pad that was selected most recently, except the Apply to all option checkbox is enabled. Note that the settings are preserved for each pad, i.e. they will be recovered when switching back to the pad.
The view-panel offers the menus:
5.7.1  File menu
Save as.. save the content of the view-panel in different formats.
Print ... hardcopy the view-panel to $PRINTER or .ps file
Produce Picture create Go4 picture from viewpanel, put it in workspace
Produce Graph
from
markers (see
description below)
Close the view-panel
If the selected pad contains point markers as created with the Go4 marker panel (see Section 5.7.7, page 58), function Produce Graph from markers will create a TGraph object containing the marker x,y coordinates. The new TGraph is named “<Panelname>-Markergraph_<Number>” and is put into the Workspace folder of the Go4 browser. This is useful to choose certain points in a 2d histogram for a fit. Then one can apply the Go4 fit panel on the TGraph data later.
5.7.2  Edit menu
Show Marker Editor open marker panel
Show ROOT Attributes open ROOT graphics editor
Show Event Status toggle ROOT event status in bottom line
1:1 coordinate ratio adjust pad margins to 1:1 coordinate ratio
Default pad margins restore default pad margins
Clear Markers clear all marker
objects in pad
Clear Pad clear contents of current pad (and sub-pads)
Clear Canvas removes content and pad divisions
5.7.3 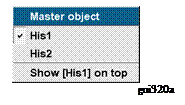 Select menu
When histograms or graphs are displayed in
superimpose mode, each one may be selected here. Then attributes like color may
be set for selected histogram. If the selected object is currently not on front
of all superimposed objects, an additional menu entry “Show ... on top”
will appear. When chosen, this entry will pop the selected object to the
foreground. Note that the object first
must be selected and then set to top.
5.7.4 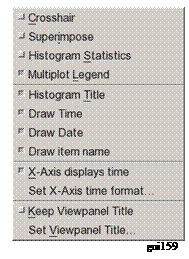 Options menu
Crosshair toggle the ROOT pad crosshair mode
Super Impose toggle superimpose option
Histogram Statistics toggle display statistics box on pad
Multiplot Legend show legend for superimposed
histograms
Histogram Title toggle display histogram title on pad
Draw Time display refresh time in histogram title box
Draw Date display refresh date in histogram title box
Draw item name display full path and name in histogram title box
X-Axis displays time toggle X-axis shows data as timescale
Set X-Axis time format… define ROOT axis time format Keep View panel Title Do not overwrite title
Set View panel Title Set the title
With Settings->Panel defaults one can set defaults for these values. If the Superimpose option is selected, any new histogram that is dragged to this pad will not replace the existing histogram, but will be displayed in the same pad with the old one (as ROOT THStack). A legend box will show the graphical style and the name for each drawn curve. This legend can be toggled on or off with the Multiplot Legend option. The text of each legend entry can be changed by opening the right mouse button popup menu at the entry position and using the SetEntryLabel function (see ROOT TLegend class for documentation of further methods in this menu).
It is possible to extend the regular histogram title by information on the refresh time and date by switching on the options Draw Time, and Draw Date , respectively. Additionally, the full name of the displayed object, i.e. the complete path and item name in the Go4 browser, may be displayed in the histogram title by toggling the Draw item name option.
Usually, the title of the view panel window (showing up in the Windows menu of the main Go4 window) is taken from the object that was drawn most recently in one of the sub-pads. This behavior can be changed by options Keep View panel Title and Set View panel Title , respectively. This allows specifying a meaningful name for a view of several histograms that will not change when one histogram is exchanged by drag and drop on a sub-pad.
The Show event Status option in the edit menu will display the current mouse coordinates and histogram channel contents in the bottom line of the view panel. If the canvas is divided, this information always refers to the selected pad.
5.7.5 Zoom toolbox
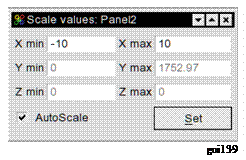 The Zoom toolbox
 ![]() contains zoom and shift buttons for the x-, y
and z- axes, working on the active pad (red frame). The expansion/compression
factor can be set in % of the current range. The Un-zoom
all button
contains zoom and shift buttons for the x-, y
and z- axes, working on the active pad (red frame). The expansion/compression
factor can be set in % of the current range. The Un-zoom
all button ![]() will restore the complete range of all axes.
The set limits button
will restore the complete range of all axes.
The set limits button ![]() will pop up a scale window. Here the range can
be typed in and set explicitly by axis values. Additionally, the scaling behavior
of the ROOT histogram can be changed: By default (AutoScale on), the y-axis (1D histogram) or z-axis (2D histograms),
respectively, is expanded to cover the full range of channel contents whenever
a memory histogram is updated, or when a monitored histogram is refreshed from
the analysis. With AutoScale disabled, the previous y-range (1D) or z-range (2D), respectively,
is invariant over any updates. This allows to observe a magnified region of
interest in a spectrum, independent of the maximum peak height. Note that the y
range of a 1D histogram can be chosen freely by ROOT TAxis selection with the
mouse, i.e. clicking with left mouse button on the y-axis for the first limit,
and dragging the pressed mouse to the second limit of the range. The scale
window is automatically connected to the selected pad and updated accordingly.
Note that the AutoScale state for the current pad is also accessible as checkbox at the top
of the viewpanel window.
Button “a” provides
auto-zoom functionality for 1/2/3-dim histogram. This automatically adjusts
range selection to non-zero content of the histogram. Can be activated also
with Ctrl * keys combinations.
will pop up a scale window. Here the range can
be typed in and set explicitly by axis values. Additionally, the scaling behavior
of the ROOT histogram can be changed: By default (AutoScale on), the y-axis (1D histogram) or z-axis (2D histograms),
respectively, is expanded to cover the full range of channel contents whenever
a memory histogram is updated, or when a monitored histogram is refreshed from
the analysis. With AutoScale disabled, the previous y-range (1D) or z-range (2D), respectively,
is invariant over any updates. This allows to observe a magnified region of
interest in a spectrum, independent of the maximum peak height. Note that the y
range of a 1D histogram can be chosen freely by ROOT TAxis selection with the
mouse, i.e. clicking with left mouse button on the y-axis for the first limit,
and dragging the pressed mouse to the second limit of the range. The scale
window is automatically connected to the selected pad and updated accordingly.
Note that the AutoScale state for the current pad is also accessible as checkbox at the top
of the viewpanel window.
Button “a” provides
auto-zoom functionality for 1/2/3-dim histogram. This automatically adjusts
range selection to non-zero content of the histogram. Can be activated also
with Ctrl * keys combinations.
When the zoom tool panel is active,
there are several useful keyboard shortcuts (see also the tooltip help of the
corresponding buttons):
Ctrl-Left/Ctrl-Right: Expand/Un-expand
range on x axis
Left/Right:
Move
Histogram left/right on x axis (only if range was expanded)
Up/Down: Expand/Un-expand
range on y axis (sets autoscale off!)
Shift-Up/Shift-Down: Move
Histogram up/down on y axis (only if range was expanded)
Ctrl-End/Ctrl-Home: Expand/Un-expand
range on z axis (sets autoscale off!)
Shift-Home/Shift-End: Move
Histogram up/down on z axis (only if range was expanded)
Ctrl-Minus: Un-zoom
ranges totally
Ctrl-Plus: Show/hide
range settings window
Ctrl-Star: Apply
auto zoom (adjust range to show non-zero region only)
5.7.6 Draw options and axis scaling
Draw options and
axis scaling can be set by two toolbars: One for all options available (Settings->Show/hide->Draw Options) steered by pull down menus (as described below):
![]()
gui366
and one for a subset (Settings->Show/hide->HIstDraw Options) steered by buttons only:
![]() gui367
gui367
Both toolbars also offer buttons to change the line color ![]() , the
fill color
, the
fill color ![]() , and
the marker color
, and
the marker color ![]() of the selected object, resp. Each of these
buttons will open a color selection window.
of the selected object, resp. Each of these
buttons will open a color selection window.
The button icons of the HistDraw Options toolbar correspond to the
draw option icons as shown in the pull down menus below. Additionally, buttons ![]() and
and ![]() will
scale the Y axis linear or logarthmic,resp; buttons
will
scale the Y axis linear or logarthmic,resp; buttons ![]() and
and ![]() scale the X axis, and buttons
scale the X axis, and buttons ![]() and
and ![]() the Z axis, resp. When the HistDraw Options is
active, keyboard shortcuts exist for fast toggling the y axis scale:
the Z axis, resp. When the HistDraw Options is
active, keyboard shortcuts exist for fast toggling the y axis scale:
Ctrl-Page Up: Y
axis in logarithmic scale
Ctrl-Page Down: Y
axis in linear scale
Buttons ![]() and
and ![]() set the 1d histogram line style to “scatter” and
“simple line”, resp.
set the 1d histogram line style to “scatter” and
“simple line”, resp.
The Go4 draw options follow the ROOT draw options (see table on next page).
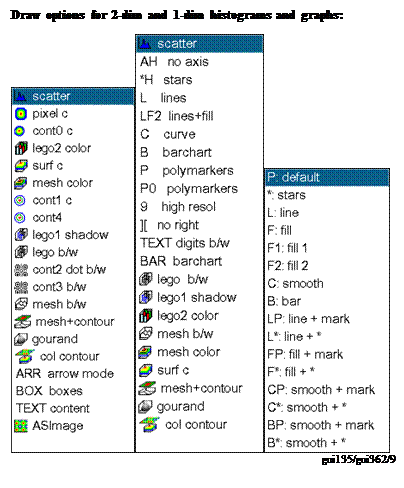
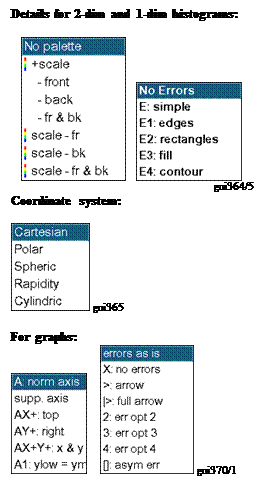
|
Go4 option |
Description |
ROOT |
|
scatter |
black scattered points |
HIST |
|
pixel c |
colored pixels |
COL |
|
cont c |
colored contour |
CONT |
|
surf c |
colored surface |
SURF2 |
|
pix+scale c |
colored pixels and color scale bar |
COLZ |
|
cont+scale c |
colored contour and color scale bar |
CONTZ |
|
Gouraud |
smooth grey scale surface |
SURF4 |
|
lego c |
colored lego |
LEGO2 |
|
lego/shadow |
lego with one side colored |
LEGO1 |
|
lego bw |
black and white lego |
LEGO3 |
|
mesh c |
colored meshed surface |
SURF1 |
|
mesh bw |
black and white meshed surface |
SURF |
|
mesh+cont |
bw meshed surface and colored contour on top |
SURF3 |
|
line c |
colored contour lines |
CONT1 |
|
line dot bw |
black dotted contour lines |
CONT2 |
|
line bw |
black contour lines |
CONT3 |
|
boxes bw |
black boxes |
BOX |
|
digits bw |
channel content as numbers |
TEXT |
|
ASImage |
TH2 as TASImage (fast pixel map with scale bar) |
|
|
P0 (1D) |
Polymarker without lines |
P0 |
|
L (1D) |
Line |
L |
|
C (1D) |
Smooth curve |
C |
|
B (1D) |
Bar chart |
B |
|
mesh+cont2 |
bw meshed surface and colored contour on top |
SURF5 |
|
cont4 |
colored contour |
CONT4 |
|
cont1+ pal |
colored contour lines and color scale bar |
CONT1 |
|
cont4+pal |
colored contour and color scale bar |
CONT4 |
|
arr (2d) |
arrow plot |
ARR |
5.7.7 Channel and window markers
In a view panel a marker panel can be opened by Edit►Show Marker Editor menu item:
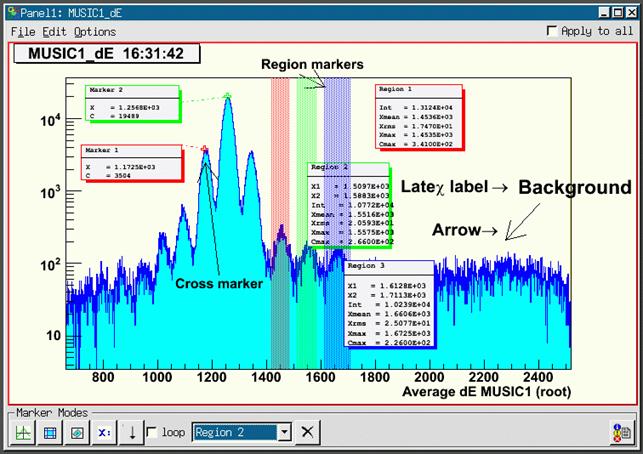
gui324
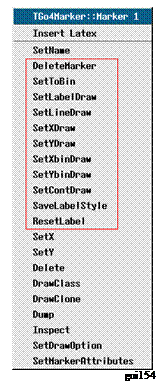
Pressing once on ![]() button and then one more time in the pad, a channel
marker (cross) with a label and a connecting line is drawn. Once created, any
marker can be re- positioned by chosing its name in the marker selection box
and using again the
button and then one more time in the pad, a channel
marker (cross) with a label and a connecting line is drawn. Once created, any
marker can be re- positioned by chosing its name in the marker selection box
and using again the ![]() button: the next pad click moves the currently
active marker to the picked position. If new is chosen in
the marker selection box, a new marker is created and added to the list. Note
that the selected marker is always displayed on front of all other objects in
the pad. Clicking on a marker or its label box with the left mouse button will
also pop it frontmost.
button: the next pad click moves the currently
active marker to the picked position. If new is chosen in
the marker selection box, a new marker is created and added to the list. Note
that the selected marker is always displayed on front of all other objects in
the pad. Clicking on a marker or its label box with the left mouse button will
also pop it frontmost.
With new selected and loop option enabled, the cursor
stays after ![]() in point marker mode. Subsequent clicks in the
pad create new markers. This behavior also applies for the other marker types,
respectively:
in point marker mode. Subsequent clicks in the
pad create new markers. This behavior also applies for the other marker types,
respectively:
![]() draws a window marker (with two subsequent LMB
clicks) and a label.
draws a window marker (with two subsequent LMB
clicks) and a label.
![]() draws a polygon marker (TCutG): each click will define one point of the polygon, a double click
will finish the definition of the shape.
draws a polygon marker (TCutG): each click will define one point of the polygon, a double click
will finish the definition of the shape.
X: places a (Latex formatted) label. Note that in ROOT Latex syntax, instead of the “\” escape character the “#” is used, so e.g “#alpha” will produce a greek a.
![]() draws an arrow from first click to second click.
draws an arrow from first click to second click.
In loop mode one can switch between the five marker types.
![]() outputs the values of the markers to the
activated log output.
outputs the values of the markers to the
activated log output.
A selected markers can be deleted by pressing the ![]() button near the marker selection box. Furthermore,
markers may be deleted and configured with RMB on the cross or inside the
window, respectively (see right TGo4Marker menu: DeleteMarker and
button near the marker selection box. Furthermore,
markers may be deleted and configured with RMB on the cross or inside the
window, respectively (see right TGo4Marker menu: DeleteMarker and
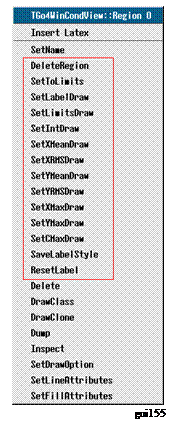 left TGo4WinCondView menu: DeleteRegion). The setter methods configure the layout through little windows as
shown above (options 0 or 1, then apply and cancel). All elements can be moved
with LMB (labels are updated). SaveLabelStyle applies current settings to all subsequent markers. With Settings►Save settings in the main Go4 window menu these settings will be stored. With Edit►Clear Markers one can remove all marker elements. To change the graphical attributes
one can use the new ROOT graphical editor. It should be opened by Edit►Show ROOT attributes editor. When a
graphical object is selected (LMB) the editor changes accordingly. Close the
editors also through the Edit menu.
left TGo4WinCondView menu: DeleteRegion). The setter methods configure the layout through little windows as
shown above (options 0 or 1, then apply and cancel). All elements can be moved
with LMB (labels are updated). SaveLabelStyle applies current settings to all subsequent markers. With Settings►Save settings in the main Go4 window menu these settings will be stored. With Edit►Clear Markers one can remove all marker elements. To change the graphical attributes
one can use the new ROOT graphical editor. It should be opened by Edit►Show ROOT attributes editor. When a
graphical object is selected (LMB) the editor changes accordingly. Close the
editors also through the Edit menu.
With Settings►Panel
defaults►Marker labels one gets the window
shown below. Here the default layout can be specified and saved.
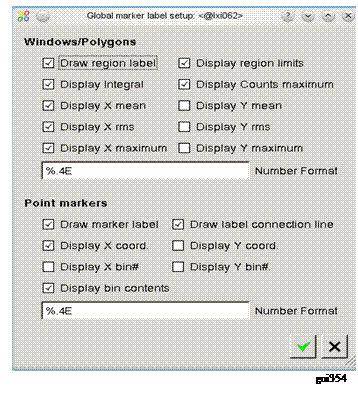
5.8 Conditions
5.8.1 Conditions editing in viewpanel marker editor
A condition may be displayed in an existing viewpanel by dragging and dropping it from the browser to a destination pad containing a appropriate histogram. The full condition editor (see 5.8.2) may also draw its working condition to the viewpanel.
It is possible to edit any condition displayed in a viewpanel already by means of the marker editor in the bottom line (see figure).
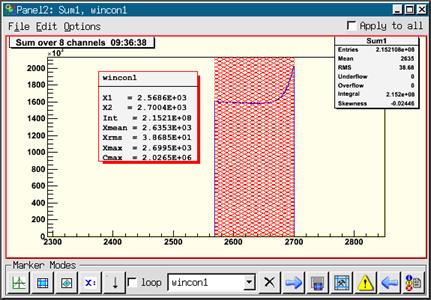
gui330
Condition wincon
1 is drawn above the histogram Sum1 that is filled only if this condition is
true. As the regular markers (see 5.7.7), the
condition may be selected by name in the marker selection box. In addition to
the control buttons for the markers, editing a condition will enable some more
buttons in the marker editor. After changing the condition by moving its
boundaries, a ![]() will appear to remind you to update the
condition by button
will appear to remind you to update the
condition by button ![]() on the analysis side. With
on the analysis side. With ![]() the current
condition state from the analysis side is refreshed in the editor window. If
working on a condition from file, the refresh button
the current
condition state from the analysis side is refreshed in the editor window. If
working on a condition from file, the refresh button ![]() will appear instead to reload the viewpanel
condition.
will appear instead to reload the viewpanel
condition.
Button ![]() opens the info window for the selected
condition (see 5.13) to
view current condition properties that are not displayed in the viewpanel
label. For advanced editing of the condition, the full condition editor may be invoked
using button
opens the info window for the selected
condition (see 5.13) to
view current condition properties that are not displayed in the viewpanel
label. For advanced editing of the condition, the full condition editor may be invoked
using button ![]() .
.
5.8.2 Full condition editor
The condition editor window is popped up when one double clicks on a
condition in the browser or using the edit function ![]() of the
browser’s right mouse menu. It may also open by using the
of the
browser’s right mouse menu. It may also open by using the ![]() in the viewpanel marker editor.
in the viewpanel marker editor.
In addition to the features of the marker editor, it may display and change all properties of the Go4 condition class, e.g. counters, testing properties, histogram statistics over the region, etc.
The following figures give some examples.
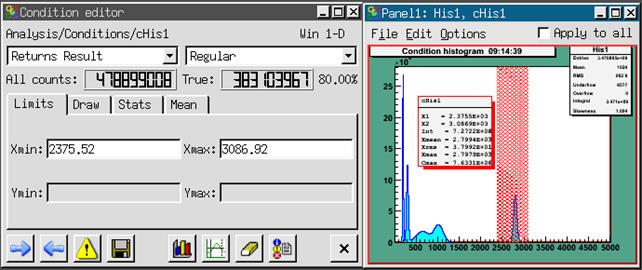
gui328
Window condition cHis1 displayed with histogram His1. The histogram has been bound to the condition by method SetHistogram() in the analysis. In this case the histogram is automatically displayed when the condition is edited.
Polygon condition polyconar is a polygon condition array from the two step example which can be displayed in a 2d view panel. When a condition array compound is edited, the index of the currently active condition can be set in the upper right spin box. The displayed values always refer to the selected array member. When selecting an entire condition array in the editor (All button or spin box index “-1”), changes will be applied to all members.
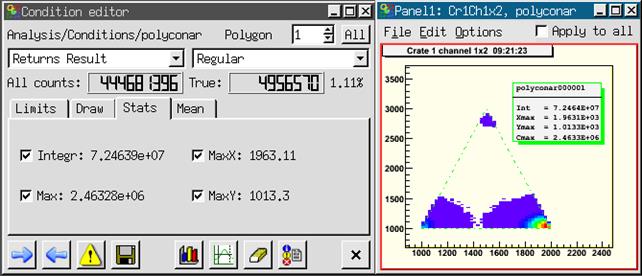
gui329
With the ![]() button the active pad of the
current view-panel (selected with middle mouse button) is set as display
working pad for the condition. The condition is drawn on this pad until the
display button is pressed again with another active pad. If the working pad
contains a histogram, it is assigned to the condition under edit and its name
is shown in the editor. Note that it is possible to exchange the condition work
histogram by drag and drop of a new histogram into the condition editor display
pad.
button the active pad of the
current view-panel (selected with middle mouse button) is set as display
working pad for the condition. The condition is drawn on this pad until the
display button is pressed again with another active pad. If the working pad
contains a histogram, it is assigned to the condition under edit and its name
is shown in the editor. Note that it is possible to exchange the condition work
histogram by drag and drop of a new histogram into the condition editor display
pad.
After editing the condition limits graphically on the working pad,
the changes will be updated automatically whenever the mouse enters the editor
window. When a condition is changed in the editor (always press Enter to
confirm changes), the graphical representation will be updated automatically. After
changing the condition, a ![]() will appear to remind you to update the
condition by
will appear to remind you to update the
condition by ![]() on the analysis side. With
on the analysis side. With ![]() the current values
(e.g. counters) from the analysis side are updated in the editor window.
Conditions can be set to return always true or false, respectively. The result
of a condition check can be inverted. A polygon condition checks, if a point
(x,y) is inside a polygon (TCutG). A window condition
checks, if one or two values are inside one or two intervals, respectively.
the current values
(e.g. counters) from the analysis side are updated in the editor window.
Conditions can be set to return always true or false, respectively. The result
of a condition check can be inverted. A polygon condition checks, if a point
(x,y) is inside a polygon (TCutG). A window condition
checks, if one or two values are inside one or two intervals, respectively.
A condition has counters for the number of all Test() calls performed, and for the number of true results. The counter
values after the last refresh are displayed in the editor. With ![]() these values are
reset to zero and the condition is
directly updated on the analysis side.
these values are
reset to zero and the condition is
directly updated on the analysis side.
The ![]() button allows to pick the boundaries of the
condition region with the mouse. This works in the same way as in the marker editor:
for window condtions, two subsequent clicks will take the click position as
limits (for 2d conditions, these clicks define corner points); for polygon conditons, each click will set a
corner point until the mouse double click finishes the pick mode.
button allows to pick the boundaries of the
condition region with the mouse. This works in the same way as in the marker editor:
for window condtions, two subsequent clicks will take the click position as
limits (for 2d conditions, these clicks define corner points); for polygon conditons, each click will set a
corner point until the mouse double click finishes the pick mode.
Button ![]() outputs the current condition values to the
GUI starting window, or into a log file if specified in the Settings menu (see 5.1). Button
outputs the current condition values to the
GUI starting window, or into a log file if specified in the Settings menu (see 5.1). Button
![]() saves the condition in a file. If the
condition editor is working on a condition in a ROOT file (via File Browser),
the
saves the condition in a file. If the
condition editor is working on a condition in a ROOT file (via File Browser),
the ![]() button will update the changes in the original
file by default. This is useful to edit conditions in an existing auto save
file.
button will update the changes in the original
file by default. This is useful to edit conditions in an existing auto save
file.
5.8.3 Editor tabs
The condition editor offers four tabs: for the condition limits, for the display properties, for the statistics inside the selected condition range, and for the mean values, respectivly They are shown in the next screen shots:
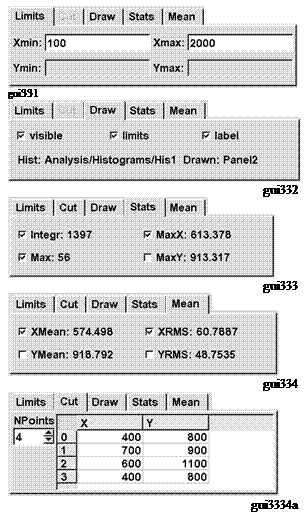 The Limits tab contains the values of the window condition limits, or the
largest extension of the polygon condition boundaries. These are updated from
the graphical representation on the working pad, or can be typed in directly in
case of window conditions (to apply the typed values press RETURN).
The Limits tab contains the values of the window condition limits, or the
largest extension of the polygon condition boundaries. These are updated from
the graphical representation on the working pad, or can be typed in directly in
case of window conditions (to apply the typed values press RETURN).
The Cut tab is only active for polygon conditions. It shows the table of x and y coordinates of the polygon (TCutG). These values may be edited here (to apply the typed values press RETURN). Moreover, the number of polygon points can be changed with the NPoints selector box. If the TCutG is edited graphically on the pad by mouse, the values in the table will be synchronized the next time the mouse enters the editor window.
The Draw tab shows the names of the histogram and viewpad used to display the edited condition, and allows to control some draw properties. Each condition can be set as visible or not with the visible checkbox. If visible, the condition is shown on the working pad, otherwise it is hidden. This is useful when working with condition arrays. It is recommended for polygon conditions to improve editing. The visibility is a property of the condition class itself and is stored in the auto-save file. The label checkbox enables the drawing of a graphical label together with the condition (see screenshot examples). This label may contain the limits values from the Limits tab; this can be toggled using the limits checkbox. Other entries of the label may be configured in the Stats and Mean tabs.
The Stats tab shows some statistics (Integral, position and channel content of the maximum) of the current histogram inside the selected condition. In addition, the Mean tab contains mean and RMS values for x and y directions. Setting the corresponding checkboxes plots these values into the label on the working pad.
5.8.4 Conditions bound to pictures
In the next example two conditions are bound to the upper pads of a
picture (see chapter 5.9, page
66) by
method AddCondition().
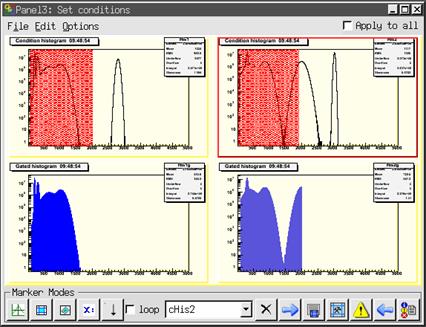
gui335
The histograms in the lower pads are filled under the condition
shown in the pad above. All picture conditions will be shown simultaneuosly (if
their visible property is true). Mouse click on a picture’s subpad will deliver the names of all contained
conditions into the selection box of the marker editor. The selected condition
may be modified and updated by means of the marker editor, or using the full
editor started by ![]() button, as described above. The mechanism to
bind conditions to picture pads guarantees that a condition is set always on
the correct histogram.
button, as described above. The mechanism to
bind conditions to picture pads guarantees that a condition is set always on
the correct histogram.
5.8.5 Creating conditions
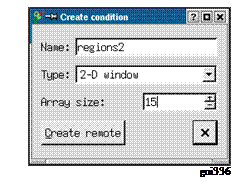 With the
 ![]() button of the main window “Tools” menu and
toolbar, one can open a window to create a new condition in the analysis. This functionality is
available as a shortcut from the dynamic list editor, too (see 5.12). The
Create condition dialogue expects a condition name, the type (1-D window, 2-D
window, polygon), and optional an array size. For Array size “no array”, a
single condition is created, otherwise a condition array compound that contains
the given number of conditions.
button of the main window “Tools” menu and
toolbar, one can open a window to create a new condition in the analysis. This functionality is
available as a shortcut from the dynamic list editor, too (see 5.12). The
Create condition dialogue expects a condition name, the type (1-D window, 2-D
window, polygon), and optional an array size. For Array size “no array”, a
single condition is created, otherwise a condition array compound that contains
the given number of conditions.
After pressing the Create remote button, the new condition will appear in the subfolder Analysis/Conditions of the Go4 browser. The name field in the create dialog may contain any subfolder path relative to this default location, e.g. Name: myconditions/region2 will create new condition region2 in folder Analysis/Conditions/myconditions. Non exisiting subfolders are created in this procedure together with the conditon.
Once created, the condition can be modified from the condition editor or from the viewpanel marker editor as described above. When the auto-save mechanism was enabled, the condition will be restored at next analysis startup. Note that it’s not possible to create a new condition without the analysis connected to the gui!
5.9 Pictures
The TGo4Picture class provides a way to set up a view in the analysis, which then can be displayed in the Go4 GUI. A picture contains:
§ references to objects (via names), which should be displayed;
§ division setups of pictures into sub-pictures;
§ draw options and parameters like line attributes, axis ranges and so on.
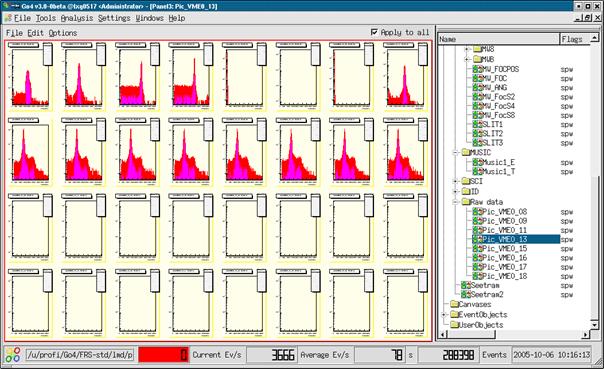
gui337
The following code creates a simple picture, which contains only one histogram:
TGo4Picture* pic = new
TGo4Picture(“pic1”,”picture title”);
pic->AddH1(histo); // histo is variable of type TH1*
A picture can be divided into sub-pictures like a ROOT canvas can be divided into sub-pads. The division of a picture can be specified in the picture constructor or by method SetDivision(int ndivy, int ndivx) which creates ndixy*ndivx sub-pictures inside the picture. Sub-pictures can be accessed via method Pic(posx, posy). For each picture (and sub-picture) one can specify the following options:
Display header pic->SetDrawHeader()
X axis range pic->SetRangeX(double, double)
Y axis range pic->SetRangeY(double, double)
X log scale pic->SetLogScale(0, bool)
Y log scale pic->SetLogScale(1, bool)
Z log scale pic->SetLogScale(2, bool)
To add an object to be drawn the following methods can be used:
TH1, TH2, TH3 pic->AddH1(TH1*)
THStack pic->AddHStack(THStack*)
TGraph pic->AddGraph(TGraph*)
TGo4Condition pic->AddCondition(TGo4Condition*)
Each method requires a pointer to the correspondent object and optional draw options (if necessary). When an object has been added to a picture, the following drawing options can be set for this object (see ROOT manuals):
Line attributes pic->SetLineAtt(Color_t,
Style_t, Width_t)
Fill attributes pic->SetFillAtt(Color_t,
Style_t)
Marker attributes pic->SetMarkerAtt(Color_t,
Size_t, Style_t)
Draw options pic->SetDrawOption(Option_t *)
TStyle attributes pic->SetStyle(TStyle*)
Axis rebining pic->SetRebinX(Int_t ngroupx),
pic->SetRebinY(Int_t ngroupy)
For example, to configure a picture with four sub-pads (2 x 2), each with a different histogram, the following code can be used (first index top down, second left right):
TGo4Picture* pic = new
TGo4Picture(“pic1”, ”picture title”, 2, 2);
pic->SetDrawHeader(kTRUE); //
displays time, name and title of picture
pic->Pic(0,0)->AddH1(histo1);
pic->Pic(0,0)->SetRangeX(100,
200);
pic->AddH1(0, 1, histo2); // or
pic->Pic(0,1)->AddH1(histo2);
pic->Pic(0,1)->SetDrawOption(“lego”);
pic->AddH1(1, 0, histo3, ”lego”);
pic->AddH1(1, 1, histo4);
AddPicture(pic); // add picture to
frame work
Similarly the colors in above figure have been set up by:
Color_t his=0;
for(int i=0;i<8;i++) for(int k=0;k<8;k++){
fPict1->Pic(i,k)->SetFillAtt(his,1001);
fPict1->Pic(i,k)->SetLineAtt(his,1,1);
his+=2;
}
The TGo4Picture class supports arbitrary levels of picture divisions. This means that each sub-picture can also be divided. For instance, a picture with 3 histograms, two in top row and third in bottom row, will be created by the following code:
TGo4Picture* pic = new
TGo4Picture("pic","pic title",2,1);
pic->SetDrawHeader();
pic->Pic(0,0)->SetDivision(1,2); // divide top widget on two more pads
pic->Pic(0,0)->Pic(0,0)->AddH1(histo1); // add histogram to sub-sub-pad
pic->Pic(0,0)->Pic(0,1)->AddH1(histo2); // add histogram to sub-sub-pad
pic->Pic(1,0)->AddH1(histo1,
"lego2"); // add histogram to
sub-pad
AddPicture(pic);
Current limitations of pictures are:
§ Only histograms (TH1), graphs (TGraph) and stacks (THStack) can be add to picture or sub-picture.
§ Several histograms or graphs displayed together only when pic->SetSuperimpose(true) is set.
§ Conditions can be displayed only in pair with a histogram.
§ A condition can be added only after a histogram has been added.
In the Go4 GUI pictures will appear in the analysis browser in the Pictures subfolder. Together with the picture all correspondent histograms will be automatically transferred. Double click on a picture draws it in a new view panel. A picture also can directly drag-and-dropped into an existing view panel.
Pictures also can be put to the monitoring list. Putting a picture to the monitoring list automatically puts all histograms of the picture to the monitoring list, too.
5.10 Fit GUI
All information of a fit like models (= fit functions) and their
parameters, references to the data, and the results are stored in a fitter
object (=FO). The
fit panel (activated by ![]() button) is the editor of fitter objects. The
fit panel is attached to a fitter object to edit it. Fitter objects are
stored in two different locations:
button) is the editor of fitter objects. The
fit panel is attached to a fitter object to edit it. Fitter objects are
stored in two different locations:
§ Fitter objects can be in the browser (file or memory). By double click the fitter object is displayed in fit panel.
§ Fitter objects can be stored in a pad of a view panel (one per pad). Such fitter automatically displayed in open fit panel when pad is activated.
To create fitter for active pad, Fitter►create for pad menu item or Use pad button of fit panel should be used. The fitter object can always be copied to memory browser and than saved to the file. The data reference of a fit object is changed or set when:
§ creating or copying a fitter object to a pad,
§ dragging a histogram into a pad (the fitter object of the pad gets the reference to that histogram),
§ dragging a histogram name into fit panel.
The next picture shows a pad in a view panel and the fit panel. The peak finder tab is shown.
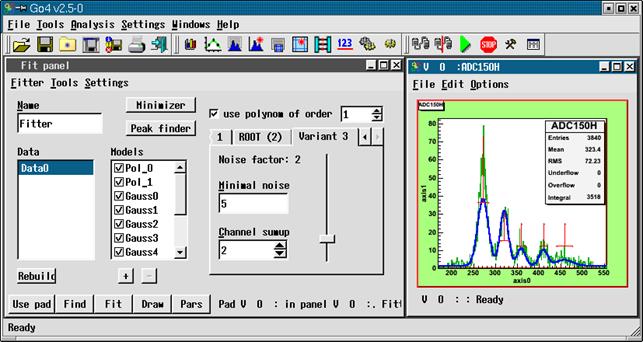
gui129
On the bottom of fit panel there are five buttons:
Use pad If fitter displayed in fit panel, it will be copied to selected pad in last active view panel. If there is no fitter in fit panel, a new fitter will be created for this pad.
Find Executes peak finder routine. All peak finder parameters should be setup first. Work only in Wizard mode.
Fit Executes fit.
Draw Draw models, backgrounds and model components as sets up in Settings sub-menu.
Pars Show all fitter parameters in a table. Parameters can be listed one by one or in lines mode, when one line corresponds to one model and contains amplitude, line position and line width.
There are three different layouts of fit panel, which can be chosen in Tools sub-menus:
Simple Contains several buttons to fit data to polynomial function,
gaussian, lorentz and exponent.
Wizard Intuitive and easy-to-use tool to setup data objects and model components. Also includes peak finder setup. Suitable for most fitting tasks.
Expert Advanced
tool, which gives full control over the fitter. Provides a hierarchy view of
all objects inside fitter and possibility to change any relevant data fields.
Supports all functionality, which may not be presented in Wizard tool.
In wizard mode there are three different peak finders available (see previous figure). Variant 2 is ROOT, Variant 1 searches peaks having specified width range above a threshold, variant 3 searches minima and maxima using a dynamic noise bandwidth. Variant 3 also allows for summing up channels to reduce the noise. Depending on the histogram characteristics, either of these may give good results. One has to play with the parameters. Changing parameters automatically launches a Find.
Found peaks are marked in the View panel pad in red. One can move their position and change their width with the mouse. Clicking on a data or model entry the right side of the panel shows related information. Models can be [de]activated clicking on the OK boxes or removed by [-]. New models can be added by [+]. After the fit the results can be seen pressing the Pars button (which changes to Back to switch the view back):
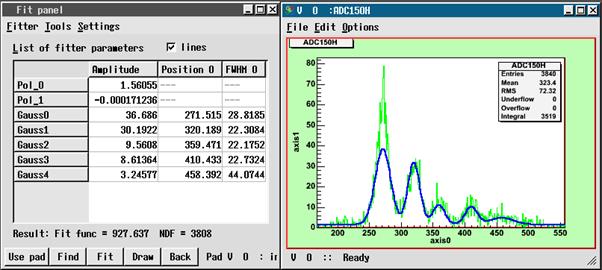
gui130
Fitter sub-menu has following items:
Create for pad create appropriate fitter for selected pad in last active preview
panel
Delete delete fitter
Save to browser save fitter to Go4 memory browser
Update reference updates references on data objects from file or memory browsers
Print parameters produces parameters printout, parameters page should be active
Rollback
parameters restore value
of parameters, which automatically stored before last fit
Close close fit panel
Settings sub-menu contains following items:
Confirmation For each delete action (of fitter, data, model and so on) confirmation message will appear
Show primitives Show graphical primitives for model position and width and for range settings
Freeze mode Fit panel is not automatically attached to selected pad, but only by create/copy/move command from Fitter sub-menu
Save with objects Save objects, to which fitter have references, together with fitter. When such a fitter will be loaded, it will have copy of saved objects. Available only in wizard or expert mode
Use current range At any fit or peak finder action automatically uses range which is currently selected on histogram
Draw model Draw model of data
Draw background Draw background (sum of all model components, belongs to background group)
Draw components Draw all model components, which are not belong to background group
Draw on same pad Use same pad for drawing or create separate preview panel
Draw info on pad Draw on pad info box with parameters values
No integral Do not show any integral values on parameters page
Counts In lines mode on parameter page additionally shows counts number for every model component inside specified range
Integral Shows integral value for every model component inside specified range
Gauss integral Calculates and shows theoretical (based on amplitude and width parameters) integral for one-dimensional gaussian components. None of specified range conditions are taken into account.
Recalc gauss width For gauss components recalculates sigma values to full width on half maximum (FWHM)
Do not use buffers Do not use any memory buffers for fit
Only for data Use buffers only for data objects
For data and models Use buffers for all data objects and model components
Individual settings Use buffers as selected individually for each data object and model component
Detailed help on fitter and fit panel can be obtained from the main window Help►Fit tutorial.
5.11 Parameters
5.11.1 Parameter objects
Parameters are objects containing a user defined structure of values. These can be applied for controlling and calibrating the user analysis apart from the analysis framework configuration. All user parameters should be subclasses of TGo4Parameter. They can be created in the user analysis code and are registered to the Go4 framework by method AddParameter(TGo4Parameter* mypar). Once a parameter was registered, it appears in the Go4 Parameters folder, it is saved and can be restored from the auto-save file, and it can be edited and updated from the Go4GUI by means of the parameter editor.
5.11.2 Parameter editor
Double clicking a parameter icon ![]() in the browser will open the parameter editor as seen in the picture. All known
members of the user parameter class and its base classes are shown here with
their names, their type and their current value.
in the browser will open the parameter editor as seen in the picture. All known
members of the user parameter class and its base classes are shown here with
their names, their type and their current value.
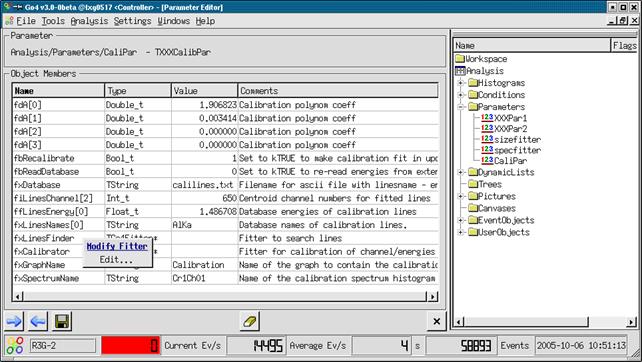
gui125
Currently supported types are:
·
all basic signed and unsigned
types, e.g. Double_t fdEnergy; Bool_t fbIsOK;
·
the ROOT TString class to wrap text strings, e.g. TString
fxMyFilename;
·
pointers to TGo4Fitter objects, e.g. TGo4Fitter*
fxUnpackfitter;
·
arrays of the above in 1 or 2
dimensions, e.g. UInt_t fuVal[42];
Float_t ffVoltage[5][100];
·
ROOT classes TArrayI and TArrayD containing arrays of integers and double
values, resp.
·
Comments behind member
declarations (e.g. ”//
my comment”) are shown in the Comments column.
Aggregations and pointers to basic types are not supported at the moment (except for aggregated fitter objects).
Arrays of data are expanded and collapsed in the table by double clicking on the array name. Additionally, the right mouse button will open a popup menu to navigate through the array without expanding it completely.
The values of the data can be edited after double clicking in the
value field of the data member table. Note that any editing action has to be
finished by pressing “return”, “tab”, or “cursor” before it is valid. To apply
the changes, press ![]() which will update the edited parameter on the
analysis side. This is done by method UpdateFrom(pointer to new) provided by the user class. This means that arbitrary functions can
be executed! The changing of data members is fully controlled by the user
class. Vice versa,
which will update the edited parameter on the
analysis side. This is done by method UpdateFrom(pointer to new) provided by the user class. This means that arbitrary functions can
be executed! The changing of data members is fully controlled by the user
class. Vice versa, ![]() will refresh the table shown in the editor
from the current values of the analysis parameter. Note that all changes not
yet applied to the analysis or saved are overwritten on refresh!
will refresh the table shown in the editor
from the current values of the analysis parameter. Note that all changes not
yet applied to the analysis or saved are overwritten on refresh!
If one is working on a parameter loaded from a file, button ![]() will appear instead of
will appear instead of ![]() , doing
a refresh from the source file. Note that the original parameter in the file is
not changed by the editor immediately; the root file is updated only when using
the save button
, doing
a refresh from the source file. Note that the original parameter in the file is
not changed by the editor immediately; the root file is updated only when using
the save button ![]() . Then
a save dialog window will appear, that allows either overwriting the original
parameter, or saving the changed object to another file.
. Then
a save dialog window will appear, that allows either overwriting the original
parameter, or saving the changed object to another file.
Finally, ![]() will
erase all editable fields of the table.
will
erase all editable fields of the table. ![]() will close the editor without modifying the
analysis parameter.
will close the editor without modifying the
analysis parameter.
5.11.3 Parameters containing fitters
Sometimes it might be useful to exchange a Go4 fitter object between the analysis and the GUI. A fitter, e.g., may be prepared using the FitGUI and then sent to the analysis client where it can be applied to some histograms during analysis. Vice versa, one might want to display the resulting parameters of automatic fits in the analysis on the GUI. Therefore, the Go4 parameter concept supports the TGo4Fitter class as aggregation member, i.e. a pointer to a fitter can be accessed by means of the parameter editor.
The Go4 framework already offers the parameter class TGo4FitterEnvelope that contains one fitter object. This fitter may be accessed in the analysis by method GetFitter(). In this case it is important that the fitter object itself is exchanged inside the parameter each time the parameter is updated. Thus the user should not keep the pointer to the fitter in his/her analysis class, but request the fitter from the (persistent) TGo4FitterEnvelope parameter with the getter method when the fitter should be used.
Additionally, any user defined subclass of TGo4Parameter may contain references to several fitters or even arrays of fitter references. Here it is the user responsibility how the fitters refresh their settings in the UpdateFrom() method. Moreover, one may implement getter and setter methods for the most important values of the fitters without the need to access the internal fitters directly. An example is TXXXCalibPar in the Go4ExampleAdvanced directory.
Pressing the right mouse button over the name of a fitter member
will open a context menu. Selecting Edit... (or doublc clicking on the
fitter) will open the Go4 FitGUI window (see chapter 5.10, page
66). A
copy of that fitter is put into the local workspace of the Fit GUI to be edited
or to be applied on any histogram. Selecting Get from FitPanel in the
context menu, the fitter in the parameter object is replaced by a copy of the
fitter that is currently active for the Fit GUI. So any fitter existing on the
GUI may take the place of any fitter inside a parameter. Note that the original
fitter member in the parameter will be lost after this action unless it is
refreshed by ![]() from analysis again! To send the changes in
the fitter back to the analysis client, like for all parameters the
from analysis again! To send the changes in
the fitter back to the analysis client, like for all parameters the ![]() button must be pressed.
button must be pressed.
Note that in case of a fitter pointer array (e.g. TGo4Fitter* fxFitters[10] ), the context menu will show both the items to manipulate the array view and to edit or update the selected fitter.
5.12 Dynamic lists
The Go4 dynamic list is a mechanism to connect the event data
with a histogram and a condition. The histogram is filled from certain data
members of the event during the analysis.
Optionally, the histogram may be filled only if a condition that is
tested against other data members of the event is true. In contrast to the
histograms filled from the compiled user analysis code, the dynamic list offers
the possibility to define these relations on-line during the running analysis.
The dynamic list and all newly created histograms and conditions may be stored
in the Go4 auto-save file and are recovered on the next analysis initialization (![]() or Submit button in the configuration
menu).
or Submit button in the configuration
menu).
In the Go4 browser, the dynamic
list folder contains all existing dynamic lists (currently only one default
list). Each list shows the existing dynamic entries by name. Double clicking on
a dynamic entry will open the dynamic list editor to display and change it.
To create a new dynamic entry,
button ![]() of the main window tools menu
will open the create new entry dialog window. Here you can define the name and the kind of the
dynamic entry. There
are 2 different kinds of Go4 dynamic entries: The TreeEntry and
the PointerEntry (see
below). After pressing “Create remote” button, the new
dynamic entry will appear in the browser in analysis subfolder DynamicLists.
of the main window tools menu
will open the create new entry dialog window. Here you can define the name and the kind of the
dynamic entry. There
are 2 different kinds of Go4 dynamic entries: The TreeEntry and
the PointerEntry (see
below). After pressing “Create remote” button, the new
dynamic entry will appear in the browser in analysis subfolder DynamicLists.
To delete a dynamic entry completely, select its icon in the Go4 browser
and select ![]() in the right mouse button menu.
in the right mouse button menu.
gui339
5.12.1 Dynamic list editor
Depending on the kind of the entry, different sub-pads of the editor are enabled: The Histogram and TreeDraw sub-pad for the TreeEntry, and the Event data and Condition sub-pad for the PointerEntry, respectively.
Any dynamic entry can be enabled or disabled by switching the enabled checkbox. A disabled entry will not be processed, but is still in the dynamic list. Note that if a dynamic entry fails on initialization (e.g. unknown object names), it is disabled automatically.
To apply the changes, press ![]() which will update/create the edited entry on
the analysis side, respectively. Vice versa,
which will update/create the edited entry on
the analysis side, respectively. Vice versa, ![]() will refresh the values shown in the editor
from the current status of the analysis dynamic entry. Note that all changes
not yet applied to the analysis are overwritten on refresh! A
will refresh the values shown in the editor
from the current status of the analysis dynamic entry. Note that all changes
not yet applied to the analysis are overwritten on refresh! A ![]() label will appear near the update button if
the changes have not been applied to the analysis yet.
label will appear near the update button if
the changes have not been applied to the analysis yet.
If one is working on a dynamic entry loaded from a file, button ![]() will appear instead of
will appear instead of ![]() , doing
a refresh from the source file. Note that the original dynamic entry in the
file is not changed by the editor immediately; the root file is updated only
when using the save button
, doing
a refresh from the source file. Note that the original dynamic entry in the
file is not changed by the editor immediately; the root file is updated only
when using the save button ![]() . Then
a save dialog window will appear, that allows either overwriting the original
parameter, or saving the changed object to another file.
. Then
a save dialog window will appear, that allows either overwriting the original
parameter, or saving the changed object to another file.
![]() will clear the target histogram in the analysis to zero counts, and will
reset the events in the backstore tree (in case of tree draw entry, see below.)
This allows to observe changes of the
dynamic entry setups directly if the target histogram is monitored.
will clear the target histogram in the analysis to zero counts, and will
reset the events in the backstore tree (in case of tree draw entry, see below.)
This allows to observe changes of the
dynamic entry setups directly if the target histogram is monitored. ![]() will close the editor without modifying the
entry.
will close the editor without modifying the
entry.
The editor offers the additional
feature to get some information of the histogram and condition status from the
analysis. Clicking ![]() in the Histogram or
in the Histogram or ![]() in the Condition sub-frames will retrieve and
display the current object status in the histogram or condition status windows,
respectively (see chapter 5.13, page 73). This may be useful to check if
histogram or condition settings (dimension, ranges, bin size, etc.) are
suitable, without requesting these objects in the browser. Additionally, some
filling and testing statistics is shown here. The GUI tool tips show brief
explanations for each information line.
in the Condition sub-frames will retrieve and
display the current object status in the histogram or condition status windows,
respectively (see chapter 5.13, page 73). This may be useful to check if
histogram or condition settings (dimension, ranges, bin size, etc.) are
suitable, without requesting these objects in the browser. Additionally, some
filling and testing statistics is shown here. The GUI tool tips show brief
explanations for each information line.
The ![]() button prints the names and connections
of all existing dynamic entries to the analysis output window.
button prints the names and connections
of all existing dynamic entries to the analysis output window.
New histograms or conditions may
be created in the analysis by the ![]() or the
or the ![]() button, respectively. For histograms, the standard histogram creation
window (see chapter 5.6.3, page 52) pops up. Use the Create Remote button here. For conditions, the “new condition”
dialog is started (see chapter 5.8.5, page 63).
button, respectively. For histograms, the standard histogram creation
window (see chapter 5.6.3, page 52) pops up. Use the Create Remote button here. For conditions, the “new condition”
dialog is started (see chapter 5.8.5, page 63).
5.12.2 Entry for tree draw
Go4 uses the ROOT TTree::Draw() mechanism for the on-line
evaluation of the data. This works just as described in the ROOT users Guide: A
string expression defines which leafs of the tree shall be scanned by name.
Additionally, the name of the output histogram must be specified; the histogram
may either already exist (Create Remote from Go4 ![]() ), or it is created from the first TTree::Draw() by ROOT with automatic range and
binning. Instead of a Go4 condition, this mode works with a TCut string expression to filter the histogram
filling.
), or it is created from the first TTree::Draw() by ROOT with automatic range and
binning. Instead of a Go4 condition, this mode works with a TCut string expression to filter the histogram
filling.
Note that the TTree must exist for this mechanism. Usually, the
TGo4FileStore output will create and register
a tree that can be used here. If no file output is needed, one can switch on
the TGo4BackStore output (configuration window)
which will fill a temporary TTree in memory that is cleared after
each TTree::Draw() scan of the dynamic list. The TTree::Draw() is not performed for each single
event, but after a number of events have been filled into the tree. This
number can be specified in the user analysis by TGo4Analysis::SetDynListInterval(Int_t
val) or by the Interval field.
A new tree draw entry can be
created either from the Go4 tree viewer (drag of the tree name from the
Analysis browser and press ![]() ), or from the Create Dynamic Entry dialog. In the latter case, the tree name, the histogram name, the draw
expression and optionally a cut expression may be specified directly in the
dynamic list editor after creation. This works by “drag and drop” of historams
and tree leafs from the browser to the corresponding fields of the dynamic list
editor. Note that the TTree name is recognized automatically
from the dropped leaf.
), or from the Create Dynamic Entry dialog. In the latter case, the tree name, the histogram name, the draw
expression and optionally a cut expression may be specified directly in the
dynamic list editor after creation. This works by “drag and drop” of historams
and tree leafs from the browser to the corresponding fields of the dynamic list
editor. Note that the TTree name is recognized automatically
from the dropped leaf.
The advantage of a tree draw
entry is that it can access any level of substructures of the event if it is
resolved in the TTree (depending on split level); the
Go4 composite event data may be fully accessible here. It offers all functionality
of the ROOT TTree::Draw(). The disadvantage is that you
need to fill the event data into a tree to access it. The histograms are not filled
event by event, but the tree is processed in event buffers. The buffer size
should be adjusted by the user depending on the typical event rate. Since the
pointers to the data and the histogram are searched by name for each Draw() call, the performance is slow
compared to histogram filling from direct pointer access like in the
precompiled user analysis case.
5.12.3 Entry for event loop
gui340
In this mode (PointerEntry), the pointers to histogram, event data and
an optional Go4 condition are looked up by name once on initialization of the
dynamic list. During the analysis, these pointers are used directly to test the
condition and fill the histogram event-by-event. The information to locate the
pointers is taken from the ROOT TClass information of the user event
classes; it is not necessary to fill the event into a TTree.
For the pointer entry, at least
the name of an existing histogram and one dimension of the event data must be
specified. This is done in the Event data tab of the editor. Usually, for a
new pointer entry the histogram should be created by ![]() (see above). The new histogram item must then be dropped from the
browser to the dynamic list window.
(see above). The new histogram item must then be dropped from the
browser to the dynamic list window.
The event data is defined by the
event name and the name of the data member of the corresponding event class,
separated by a slash (“/”). The Go4 browser Analysis folder offers a view of
all existing TGo4EventElements in the EventObjects.Events folder. From here you may just
drag and drop the Data member item to the corresponding field
of the dynamic list editor. Note that data arrays are shown with their maximum
size here, you need to edit the index afterwards to specify the desired array
member.
Similarly, the data to test the
condition can be defined in the Condition tab of the editor. The condition
is usually created and registered in the compiled user analysis and is
identified by name here. Polygon conditions and 2 dimensional window conditions
need the event data specifications both in x and y directions. Note that the
condition event data lines should be left blank if the condition shall not be
tested in the dynamic entry (i.e. the
histogram is filled anyway). With ![]() a new condition can be created. Button
a new condition can be created. Button ![]() will open the editor for the specified condition.
will open the editor for the specified condition.
The advantage of the pointer
entry is that you do not need a TTree. Testing and filling is done for
each event by pointer without any additional string compare after
initialization. Therefore it is faster than the tree draw. The disadvantage is
that currently only one level of substructures and only one dimensional arrays
are supported (to be improved...). Implicit summing up of not specified array indices,
like in the TTree::Draw(), is not possible here.
5.13 Histogram/condition information
To check the properties of a
histogram or condition, general property windows exist for these objects. They
support drag and drop of icons from Go4 browser. These windows will also pop up
from the browser’s context menu when the ![]() button
is chosen.
button
is chosen.
gui341
With the ![]() button or the
button or the
![]() button of the tools menu one opens the
histogram or condition information window, respectively. To see the properties
of a histogram or condition, drag the icon from the browser into the window.
With
button of the tools menu one opens the
histogram or condition information window, respectively. To see the properties
of a histogram or condition, drag the icon from the browser into the window.
With ![]() the information is updated from analysis. With
the information is updated from analysis. With ![]() the information is output to the GUI start up
window, or into a log file if specified in the log settings (see chapter 5.1.2, page 35). With
the information is output to the GUI start up
window, or into a log file if specified in the log settings (see chapter 5.1.2, page 35). With ![]() all histograms (
all histograms (![]() all
conditions) are listed in the analysis output window.
all
conditions) are listed in the analysis output window. ![]() starts the condition editor for a condition.
starts the condition editor for a condition. ![]() displays the histogram in a view panel.
displays the histogram in a view panel.
5.14  Event information
The event information tool
window allows to control printout of event samples from the analysis. The button
![]() of the
tools menu will open the event information window. This button is also
available as a shortcut in the Qt analysis terminal. The
of the
tools menu will open the event information window. This button is also
available as a shortcut in the Qt analysis terminal. The ![]() entry of the browser’s
context menu (right mouse button) over an event itemwill open the event
information tool, too.
entry of the browser’s
context menu (right mouse button) over an event itemwill open the event
information tool, too.
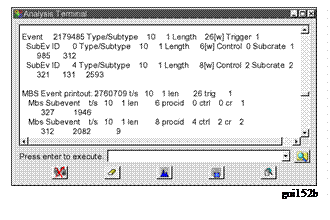 The name of the examined
event is shown in the top text line. By default, the MBS event is chosen for
printout. The event object names may be dragged and dropped to the event information
window from the Go4 browser. Clicking the
The name of the examined
event is shown in the top text line. By default, the MBS event is chosen for
printout. The event object names may be dragged and dropped to the event information
window from the Go4 browser. Clicking the ![]() button will switch to the MBS event mode
directly without the need to drag the MbsEvent-10-1 icon.
button will switch to the MBS event mode
directly without the need to drag the MbsEvent-10-1 icon.
The ShowRemote checkbox selects if the printout of the event sample is done in the remote analysis terminal, or in the terminal where the GUI was started. The TTreeSample checkbox selects if the PrintEvent() method of the event shall be called (TTreeSample off), or if the sample event shall be written to a ROOT Tree which will use the TTree::Show() method to scan and display the data (TTreeSample on). Note that for user event classes that do not implement a PrintEvent() nothing will be displayed except for the TTreeSample mode.
Each click on button ![]() will print events as shown in the upper part
of the screen shot left side. The examine button
will print events as shown in the upper part
of the screen shot left side. The examine button ![]() will display a new printout of the currently
active event (lower output on the left). Note the different format!
will display a new printout of the currently
active event (lower output on the left). Note the different format!
Additionally, for MBS events
this window provides in the MBS Event
sub-panel parameters for the SetPrintEvent() method. One can specify in the left field how many MBS events
arriving shall be printed out in a special format. In the next field a
sub-event id may be filtered (default is to display all sub-events). The hex checkbox selects to print the sub-event data either in hex or in
decimal format, while the long checkbox defines
if the data is seen as longwords or words. Pressing the ![]() button will resubmit these settings to the
analysis thus initiating a new printout of n events. Note that the MBS Event sub-panel is independent of the settings for the regular printout
of the current event. It works for the remote analysis terminal only, and it
uses a different printout format than the TGo4MbsEvent::PrintEvent() or TTree::Show() methods.
button will resubmit these settings to the
analysis thus initiating a new printout of n events. Note that the MBS Event sub-panel is independent of the settings for the regular printout
of the current event. It works for the remote analysis terminal only, and it
uses a different printout format than the TGo4MbsEvent::PrintEvent() or TTree::Show() methods.
5.15 Hot start
When starting the GUI several actions have to be done to get the analysis running. If these actions are always the same it would be convenient to save them in a file and execute this file when starting the GUI next time. This mechanism is called hot start. The typical actions are:
§ Launch analysis client
§ Submit analysis configuration
§ Get analysis folders by ![]()
§ Set histograms and pictures into monitoring state
§ Open some view panels and display histograms or pictures
After GUI and analysis are configured, one can create a hot start file by Settings►Generate hotstart. A file selection menu pops up were one can specify a file name. The postfix should be .hotstart. The next time one can start the GUI with this filename as argument (.hotstart can be omitted). Then all actions stored in the file are executed.
With care, this file could even be edited.
5.16 User GUI
Go4 provides a possibility to execute user widgets on GUI side.
There is an example of a user GUI, included in the standard Go4 distribution in
directory $GO4SYS/Go4UserGUI. It can be activated by pressing button ![]() in Tools of main window.
in Tools of main window.
The easiest way to create a user GUI is to copy the content of the standard
example to another directory (e.g. ~/UserGUI) and compile it there (make clean, make all). The user should also specify the path to this directory in GO4USERGUI
export GO4USERGUI=~/UserGUI
The GO4USERGUI variable can also include the name of the library (default libGo4ROOTUserGui.so) which is loaded when user GUI is started. This library must include
the special function StartUserGui() which loads the
qt widget library (default libGo4UserGui.so) and creates the top level widget of user GUI. At the next start of
the Go4 GUI pressing ![]() the specified
GUI will be opened.
the specified
GUI will be opened.
The user can freely modify any widgets in the example and create new ones. Changes in library names or the top widget class should be reflected in the GO4USERGUI variable and the StartUserGui() function.
There is a support of “old style” user GUI, created with older version of Go4 (up to v2.8). In that case correct path to libraries should be specified like:
export LD_LIBRARY_PATH=~/OldUserGUI/Go4Library:$LD_LIBRARY_PATH
5.16.1 Qt3 and Qt4
Currently Go4 can be built with Qt3 or Qt4. User GUIs developed with Qt3 must be converted to be used with a Qt4 based Go4. For general conversion rules see:
http://doc.trolltech.com/4.0/porting4.html
5.17 Macro execution in GUI
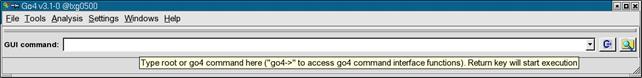
gui351
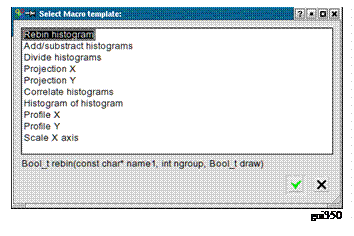 The Go4
command line toolbar can be enabled with the “Settings-Show/hide
“ menu. The typed text in the command line will be executed after pressing
“Return” by means of the ROOT CINT Interpreter, so all ROOT commands are
available here. Moreover, the Go4 command environment is aware of the current
GUI session and its objects and may access them by interface methods (see
below). Like in plain ROOT, it is also possible to run complete macros by “.x” command. The button
The Go4
command line toolbar can be enabled with the “Settings-Show/hide
“ menu. The typed text in the command line will be executed after pressing
“Return” by means of the ROOT CINT Interpreter, so all ROOT commands are
available here. Moreover, the Go4 command environment is aware of the current
GUI session and its objects and may access them by interface methods (see
below). Like in plain ROOT, it is also possible to run complete macros by “.x” command. The button ![]() opens a
browser for macros on the file system; the selected macro will be written ready
to execute on the command line. With button
opens a
browser for macros on the file system; the selected macro will be written ready
to execute on the command line. With button ![]() the menu
as shown in the figure below appears, showing a list of internally provided Go4
macros. The selected macro call will be copied to the command line where the
empty arguments (e.g. the histogram name) can be edited before execution. Note that dragging and dropping a histogram
icon from the Go4 browser to the commandline field will paste its full name
there. So one can easily apply a macro to any browser histogram by dropping the
browser icon inside the blank quotes (“”) of the name argument.
the menu
as shown in the figure below appears, showing a list of internally provided Go4
macros. The selected macro call will be copied to the command line where the
empty arguments (e.g. the histogram name) can be edited before execution. Note that dragging and dropping a histogram
icon from the Go4 browser to the commandline field will paste its full name
there. So one can easily apply a macro to any browser histogram by dropping the
browser icon inside the blank quotes (“”) of the name argument.
The given macros (located in the $GO4SYS/macros directory) can also be used as templates for other macros. An environment variable __GO4MACRO__ is defined and can be used to write macros to run in several environments: plain ROOT , Go4 GUI, or analysis (see 5.4.3, page 42).
The provided macros hishisto.C and corrhistos.C are written this way. The histograms to be processed are accessed through the Go4 browser or from a file, respectively.
corrhistos.C takes the bin contents of two histograms and creates a two-dimensional graph.
hishisto.C creates a histogram and makes a distribution of the bin contents of the source histogram.
Go4 provides an interface of class TGo4AbstractInterface to access the Go4 GUI browser. On the Go4 command line, or within a macro, resp, this interface can be invoked by the “go4->” pointer. Note that this is a different interface than “go4->” in the Go4 analysis macros (see chapter 6 on page 76) which invokes the TGo4Analysis instance! the A further description of the available TGo4AbstractInterface methods can be found in the reference manual.
Caution! Macros running inside the GUI can crash the
GUI!
$GO4SYS/macros directory should be added to entry Unix.*.Root.MacroPath in .rootrc setup file.
6 Analysis Server for ROOT macros
The Go4 analysis server offers the possibility to observe and control execution of normal ROOT macros from the Go4 GUI. This allows the development of analysis code without respect of Go4 analysis framework classes (like TGo4EventProcessor, TGo4AnalysisStep and so on) still providing remote access to the running environment of a user analysis.
It is possible with minimal effort to observe histograms, produced and filled by practically any running ROOT script. The script go4Init.C initializes Go4 and starts the analysis server in background. Function go4RegisterAll() then scans the current directory for existing histograms and makes them available remotely.
Usage:
1.
To enable ROOT to find the go4
macros one should enter in the .rootrc a line
Unix.*.Root.MacroPath:
.:$(ROOTSYS)/macros:$(GO4SYS)/Go4AnalysisClient
(Note that .rootrc may be in current directory or in $HOME.
The standard provided by ROOT is in $ROOTSYS/etc/system.rootrc)
2.
Run normal ROOT session.
Execute go4Init.C script by command:
root [0] .x go4Init.C
3.
Run user script:
root [1] .x userScript.C
4.
When go4Init() is executed, go4 will start the server and printout the port number
for connection:
"Waiting for client connection on
PORT: 5000"
5. Start the Go4 GUI in and connect to the analysis server running in the CINT. See section 5.3.2 page 39 for more.
The Go4 framework can be accessed after go4Init by the global method
TGo4Analysis* go4=
TGo4Analysis::Instance();
After this call, variable go4 can access any method of the analysis framework.
6.1 Methods for object registration
Any object to be seen remotely by the GUI must be registered by one of the following methods:
·
go4->AddHistogram(his); // makes
histogram TH1* his available in the Go4 GUI
· go4->AddAnalysisCondition(conny);// dito for TGo4Conditions
· go4->AddParameter(par); // dito for TGo4Parameters
· go4->AddPicture(pic); // dito for TGo4Pictures
· go4->AddTree(mytree); // register TTree, but do not change Tree ownership to Go4
·
go4->RemoveTree(mytree); //
unregister TTree: important to cleanup reference in Go4 if tree
//
is removed from ROOT (closing TFile !)
· Please see Go4 Reference Manual for other available Add... methods!
The go4RegisterAll() function (from Go4Init.C) registers all histograms found in the current directory. Some more information can be found in the example macros (see below).
6.2 Methods for run control and execution
· Int_t seconds=go4->WaitForStart(); Polls until the Go4 is set into the "running" state (by Start button on GUI or SetRunning() method) with 1 second interval. Returns number of seconds from begin of wait until "running" is switched true. If negative value is returned, a ROOT interrupt has happened during wait (e.g. Ctrl-C on CINT Canvas).
· Int_t state=go4->Process(); Process one main cycle of Go4 event loop from macro. Will first execute any command from GUI, second call the Go4 main cycle to process analysis steps, user event function and dynamic list (if existing). This call is required inside any explicit loop in the macro to process go4 framework analysis actions. The GUI event rate meter is also updated by this method. Return value is <0 if running state is stopped, otherwise 0.
·
go4->SetRunning(Bool_t on); Switch Go4 running state from inside a macro. Useful
to react on analysis conditions
· Bool_t on=go4->IsRunning(); Check the running state of the Go4. Maybe obsolete since this is done implicitly in methods WaitForStart() and Process(). However, macro loop may be controlled from GUI independent of Go4 main loop processing.
6.3 Examples:
The following examples can be found in $GO4SYS/macros directory. It is recommended to copy these macros to a user directory with write access, before executing them.
·
hsimple.C This is a standard ROOT
example from $ROOTSYS/tutorials. The only modification is to call
go4RegisterAll() after creating histograms.
To run this example, start a regular ROOT session, init the Go4 server and
execute script:
root [0] .x go4Init.C
root [1] .x hsimple.C
· hsimplego4.C A variation of hsimple example. This macro will wait until the Go4 start button is pressed and then run the random filling in infinite loop (mind your disk space, since a TNtuple is filled into a file here!) Registered objects may be monitored. The loop can be started and stopped at any time from the Go4 GUI. Please try the remote tree draw on the TNtuple from the Go4 GUI and view the newly created histograms. Try to launch the TBrowser before executing the macro and inspect the content of the "Go4" folders locally...
·
treedrawgo4.C Macro works on tree in a
file. As before, first execute .x go4Init.C:
root [0] .x go4Init.C
root [1] .x treedrawgo4.C("filename")
The "filename" specifies a ROOT
file "filename.root" that
contains a TTree. Note: first tree found in file will be used.
This macro contains 2 examples on trees:
1. Direct TTree::Draw() expressions are executed; after finishing, a message is sent to the Go4 GUI and the output histograms may be viewed here.
2. After registration of the TTree, the go4->Process() will be executed in a loop. Please try the remote tree draw on the TTree from the GUI and view the result histograms. Loop may be controlled by the Start/Stop buttons as in example hsimplego4.C.
Control
of remote analysis macro from Go4 GUI
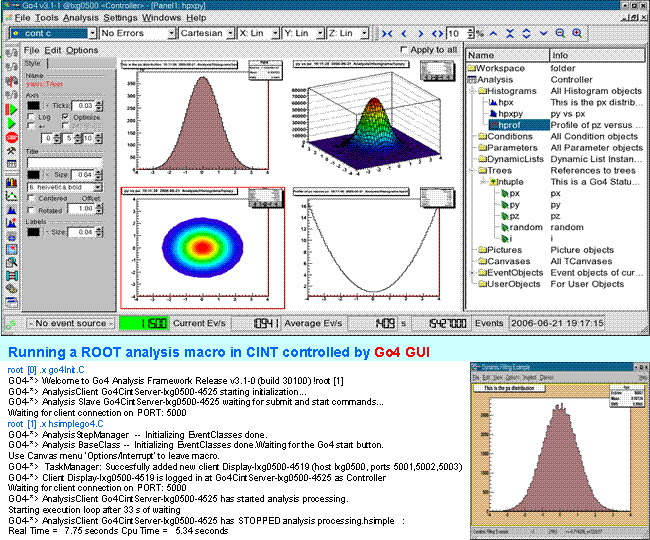
gui359
7 Control of remote Go4 analysis from a ROOT session
Besides the full featured Qt GUI, the Go4 analysis may be controlled and observed by a regular ROOT CINT session, using the native ROOT GUI for display.
The following screenshot shows at the bottom a go4 CINT analysis server task. Here example hsimplego4.C is running (see 6.3). This process is connected with the ROOT session in the upper part of the picture, which uses the regular ROOT GUI to browse and display the analysis objects. This is just like it would be possible with the usual Go4 GUI. Actually, a multithreaded Go4 master task is running in the background of the upper ROOT session, while a Go4 slave task is working on the analysis in the lower root session. This analysis process may not only be a root session with Go4 analysis server, but may as well be a compiled Go4 analysis client executable (MainUserAnalysis).
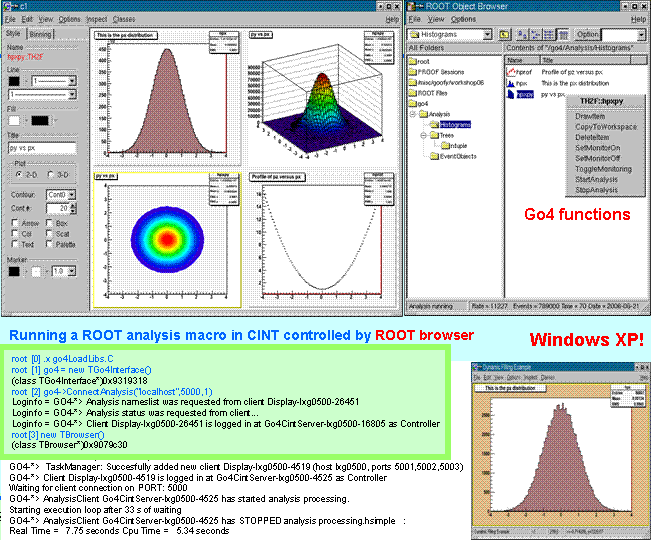 gui360
7.1 Initialization
The controlling Go4 master process is realized in the ROOT session by the TGo4Interface class. After starting a regular ROOT and loading the Go4 libraries, the call
root [0] new TGo4Interface
will instantiate the master task framework. Explicit loading of libraries is
not necessary if the corresponding ROOT mapfile mechanism is used. Once
initialized, the variable go4
is defined as a pointer to the interface instance and
may use all methods of class TGo4Interface.
Note that in the
analysis server session as described in section 6, variable go4
refers to the class TGo4Analysis instead!
7.2 Connecting the analysis
To connect to an existing analysis server,use
root [1] go4->ConnectAnalysis("localhost",5000,0,
"XXXview");
Arguments are: hostname of the server, the port number, the login account (0=observer, 1=controller, 2=administrator), and the password. If password is left out, the default password of this account is used.
Alternatively,
an analysis client may be started from this session using
root [1]
go4->LaunchAnalysis("test","/u/user1/go4",
"MainUserAnalysis","lxi003");
With arguments: arbitrary name (“test”), path to the analysis executable, name of the analysis executable, and node where analysis process shall be started.
The above methods correspond to the Connect analysis and Start analysis dialogues of the Go4 GUI (section 5.3).
7.3 Controlling the analysis by command
Once the connection to the analysis process is established, it can be controlled by several methods:
· go4-> SubmitAnalysisConfig(); Submit the analysis configuration. This corresponds to the Submit button of the Go4 GUI. Usually, the configuration is retrieved from analysis after connection. It may be modified by several methods of the TGo4Interface before submit, or it may be submitted unchanged. A submit is required in any case before analysis can be started. Note that this command is not allowed when logged in as observer.
· go4-> StartAnalysis(); Start the analysis run. This corresponds to the Start button of the Go4 GUI. Note that this is not allowed when logged in as observer.
· go4-> StopAnalysis(); Stop the analysis run. This corresponds to the Stop button of the Go4 GUI. Note that this is not allowed when logged in as observer.
· go4-> StartMonitoring(Int_t period=10); Start monitoring all objects that are set to monitoring state and drawn. The update period can be specified in seconds.
· go4-> StopMonitoring(); Stop monitoring all objects. Will not reset the monitoring property of the objects.
· go4->DisconnectAnalysis(); Remove connection to remote analysis process.
For a complete reference of available methods, please see the header file $GO4SYS/include/TGo4Interface.h.
7.4 TBrowser extensions
In addition to
the analysis control by TGo4Interface calls, the regular ROOT browser will
offer some extensions after the connection has been established. Start the
browser with:
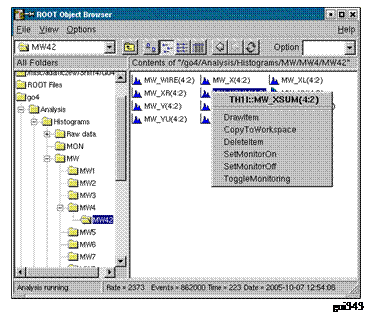 root [2] TBrowser br; .
If connected to the analysis, there is a Go4 folder among the regular ROOT folders. This will browse the structure of the remote analysis with subfolders and all objects. Both histograms and Go4 pictures may be drawn to a new canvas by double clicking on the item. Go4 conditions will be drawn on double-click only together with the histogram that was bound to it. The ROOT right mouse button menu has entries added for the remote Go4 objects:
· Draw Item - will draw it if possible, just like double-click
· Copy to Workspace - Produce fix copy to the Workspace folder in local memory. Just like in the regular Go4 GUI.
· Delete Item - remove object from analysis if possible
· Set Monitor On/Set Monitor Off - Switch the monitoring property of the selected object
· Toggle monitoring – Start and stop monitoring in general. A dialog will appear to request the monitoring periods in seconds. For zero period, monitoring will be stopped. This corresponds to TGo4Interface methods StartMonitoring() and StopMonitoring().
The status line at the TBrowser bottom will show the analysis rate meter, and eventually some messages retrieved from the analysis. Additionally, the status messages are printed out to the CINT terminal.
8 Go4 analysis with DABC based webserver
8.1 Startup of go4analysis with webserver
When Go4 has been installed
together with DAQ framework DABC (i.e. environment DABCSYS is set during
compilation and points to DABC installation, version >= 2.6.0), additional
plug-ins are generated that allow exporting the Go4 analysis objects like histograms
through a webserver. This functionality is then available in go4analysis runtime executable and can
be activated via additional command line parameter "-http PORTNUM", e.g.:
go4analysis –stream r2d2.gsi.de –http
8090
will read DAQ data from MBS stream server on node r2d2.gsi.de and will open web server on localhost with port 8090.
Alternatively, the Go4 analysis process can be connected via a special tcp/io socket to a separate DABC process that offers a web server. This DABC “master process” can collect data from several different applications (e.g. MBS, Go4, FESA) and export their objects to be monitored to one common http server. Such connection to DABC is initiated by command line parameter “-dabc master HOST:PORTNUM”, e.g.:
go4analysis –stream r2d2 –dabc master
lxg0517:8090
8.2 Viewing analysis objects with web browser
Both web servers of standalone go4analysis and the DABC master process offer the same javascript based display to any web browser. The screenshot below shows the browser view of standard example Go4Example2Step:
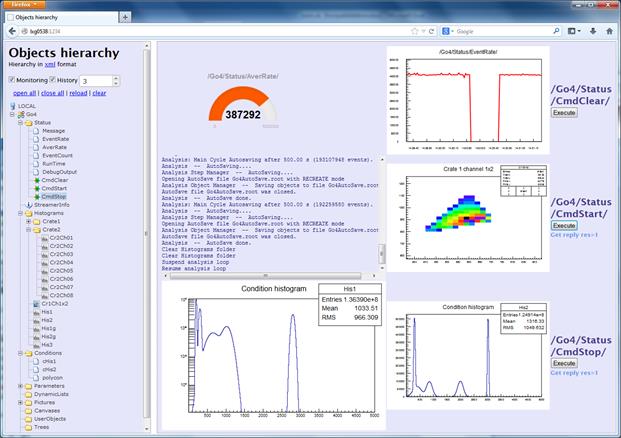
The left browser frame reflects the Go4 objects hierarchy, like it is done in the native Go4 GUI browser. Double clicking on a histogram icon will draw it on the next free view pad in the display frame on the right side. The division of the display frame into pads can be set up with the number spin box on top of the objects hierarchy frame (2 means a 2x2 grid of pads). When the Monitoring checkbox is selected, the displayed objects are frequently refreshed every 3 seconds.
The histogram display in the view pad can be changed by a pop-up menu that appears when clicking the right mouse button over it (see picture on right side). Moreover, axis ranges can be changed by holding the left mouse button over a histogram and defining a square region by dragging the mouse.
 In addition to the Go4 objects, the hierarchy frame contains a Status folder with elements to monitor
and to control the Go4 runtime environment, such as rate meters, commands, and
log messages text. For example, EventRate measures the processed data events per
second, as known from the GUI status display. When a ratemeter icon in the object tree is doubly clicked, the
next free view pad will show a visual representation, either a circle gauge (if
the “History” checkbox in the
hierarchy frame is not set), or a time trending histogram (if “History” is set). If Monitoring is also checked, the rate
meter value will be continuously refreshed.
In addition to the Go4 objects, the hierarchy frame contains a Status folder with elements to monitor
and to control the Go4 runtime environment, such as rate meters, commands, and
log messages text. For example, EventRate measures the processed data events per
second, as known from the GUI status display. When a ratemeter icon in the object tree is doubly clicked, the
next free view pad will show a visual representation, either a circle gauge (if
the “History” checkbox in the
hierarchy frame is not set), or a time trending histogram (if “History” is set). If Monitoring is also checked, the rate
meter value will be continuously refreshed.
The Message icon if doubly clicked will printout all Go4 log messages into a scrollable text field. Again with option “History” enabled, one also gets all previous messages.
Displaying a command object from the Status folder will show an interactive control button on the view pad (see right column in screenshot). Clicking the button will activate this command in the analysis process, e.g. CmdClear, CmdStart, and CmdStop, to clear all histogram contents, start and stop the analysis processing, resp.
The most recent return value of each command is shown below the button.
This overview lists all control widgets of the Objects Hierarchy frame:
Monitoring checkbox: if checked, all displayed objects are frequently refreshed every 3 seconds.
History checkbox: if checked
· rate meters are displayed as trending graphs;
· log message textbox shows all previous messages
Division spinbox: defines matrix of pads in the view frame, e.g. 3 means 3x3 pads
open all: unfolds the complete object list
close all: compress the complete object list
reload: reload web page
clear all: clear the view frame and set up division as defined by Division spinbox
9 The Go4 Composite Event Classes
9.1 Introduction
The Go4 framework applies the concept of the ”event” structure (or class) that represents a set of data values belonging to the same processing cycle of the analysis loop. As explained before in this document, such event classes are used both for the input, and for the output data of each analysis step. Which data belongs to each event cycle is firstly defined by the data acquisition system that reads out and stores such values together. Mostly an event may correspond to a certain “trigger” situation of the experiment. Here it represents e.g. the record of all physical interactions in the detector after the reaction between a beam particle and a target. But it could as well be just a container for data acquired within a given time interval. At later Go4 analysis steps, the event representation may be redefined by skipping, cutting out, or combining input events.
An experimental set up often consists of DAQ or detector components and subcomponents. These can be many of the same kind, or many various ones. Each kind of subcomponent may acquire data of the same structure. The subcomponents must be bundled into components which finally are aggregated to the complete event data representation. The depth of the subcomponent hierarchy is principally not limited here.
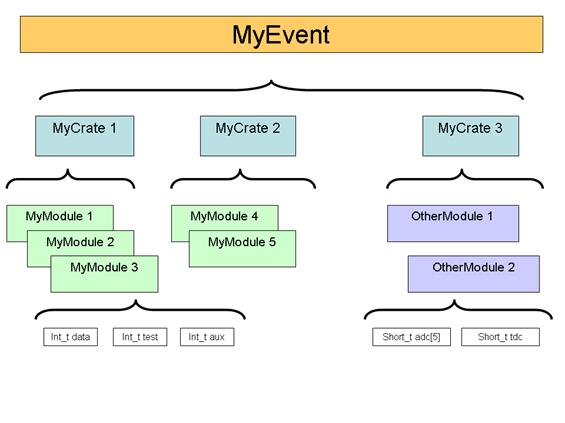
A typical example is shown in this simplified object diagram. The complete event structure MyEvent consists of three subcomponents MyCrate1, MyCrate2, and MyCrate3 which represent a certain DAQ crate hardware. Each of these crates contains a number of MyModule or OtherModule subcomponents. These provide primitive variables data, aux, adc[5], etc. which hold the actual data read out by such module. Hence this example is reflecting the partitioning of the DAQ hardware. For advanced event structures with detector hits, or physics data, it is also very likely though that a similar substructuring occurs.
To define a Go4 event class for this situation, the user could of course just aggregate similar subcomponent objects by means of collection classes, like std::vector, or TObjArray. Storage of such “composite” class with ROOT I/O into TGo4FileStore - Trees should be no problem. However, when using the ROOT or Go4Treeviewer tool, the representation of the subcomponent data would not show up as separate leaves, even in full tree split mode 99. Thus the usage of a quick TTree::Draw() analysis would be impossible for this approach. Moreover, it would not be possible to identify each single subcomponent by name and apply e.g. partial i/o when reading back the data, or search for the component in the full input event.
Because of this, the Go4 framework provides the TGo4CompositeEvent class with generic functionality to aggregate any level of subcomponents with TGo4EventElement objects. When written into the TGo4FileStore with splitlevel 99, the primitive data members of each subcomponent will appear as a separate leaf in the ROOT Tree. Moreover, any subcomponent can be retrieved from the top event object by name, or by id number. The TGo4CompositeEvent implementation uses a TObjArray for the collection of subcomponents, but redefines the ROOT branch i/o for each subcomponent.
9.2 Application Programmers Interface
Using the composite event in own Go4 analysis code is based on inheritance from the two interface classes TGo4CompositeEvent and TGo4EventElement.
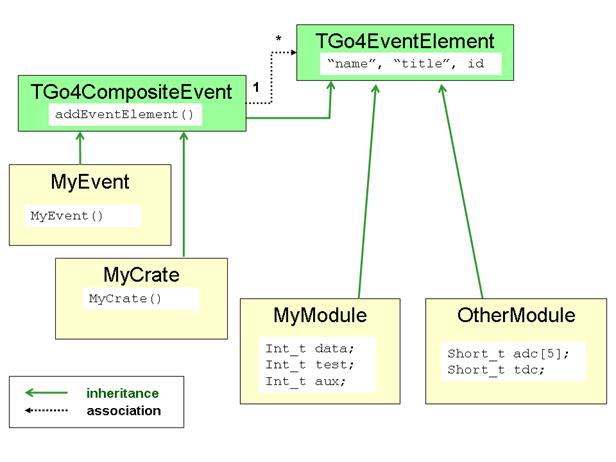
Elementary subcomponent classes should inherit from
TGo4EventElement . These classes are elementary bricks of the data structure which contain
members of all data-types that the ROOT system supports in its IO split mechanism. In order to create an elementary object, one should follow the TGo4EventElement general interface, and according to this interface
the data object should have as parameter of its constructor
· a name (const char*)
· a title (const char*)
· a unique identifier (Int_t)
The name will be used to generate the corresponding TBranchElement branch names
in the ROOT TTree
layout. The identifier should be unique for each user class.
Data-container classes should inherit from TGo4CompositeEvent. This applies for all classes which will aggregate subcomponents of TGo4EventElement implementation. Because the TGo4CompositeEvent is also a subclass of TGo4EventElement, it is possible to aggregate composites of subcomposites with theoretically unlimited depth. To add a subcomponent to a composite event collection, the interface method
· TGo4CompositeEvent::addEventElement(TGo4EventElement * evt)
is to be used when the composite object is created.
To access any subcomponent within a top composite event, there are two methods provided:
·
TGo4CompositeEvent::getEventElement(const char* name) will retrieve pointer to
event element by name. Note that this function is invoked full recursively,
i.e. the component name is searched in all subcomponent composites.
·
TGo4CompositeEvent::getEventElement(Int_t ix) will retrieve pointer to event element by index number in the collection
of this composite event. Such method is not recursive, but restricted to the
current composite event object.
A simplified UML class diagram of the component example described above is shown in the figure.
Green solid arrows indicate inheritance (arrow points to the base class); dashed black arrows show aggregation association between composite event and event element (one composite event “1” may contain many event element objects “*”). It is obvious that TGo4CompositeEvent is a subclass of TGo4EventElement, thus allowing to recursively aggregate subcomponents of composite events.
To implement event object structure of the example situation, classes MyEvent and MyCrate are derived from TGo4CompositeEvent. Classes MyModule and OtherModule, containing primitive data variables, are simply derived from TGo4EventElement. The actual set up of the composite object may be done in the constructors of the composite classes. Constructor MyEvent() will instantiate the contained MyCrate objects with unique names and id numbers, and put them to the subcomponent collection by means of the addEventElement() interface. The MyCrate() constructor of each crate will do similarly for the MyModule, or OtherModule components. A general object configuration may be read from such constructors to tell by id number which subcomponent should be created when the Go4 event classes are initialized.
9.3 Example
An example usage of a TGo4CompositeEvent can be found in $GO4SYS/Go4ExampleAdvanced. The composite structure is here very similar to the case as discussed above: The input event of the first step TXXXUnpackEvent is a TGo4CompositeEvent with subcomponents of class TXXXCrate. Each TXXXCrate is also a TGo4CompositeEvent, containing a configurable number of TXXXModule objects. The latter is a simple TGo4EventElement with a structure of elementary variables fiData, fiTest, and fiAux:
class
TXXXModule : public TGo4EventElement
{
public:
TXXXModule():TGo4EventElement(),
fiData(0) {;}
TXXXModule(const
char* name, Short_t id):
TGo4EventElement(name,name,id),
fiData(0) {;}
virtual
~TXXXModule() {;}
void
Clear(Option_t *t="")
{
fiData=0;
fiTest=0;
fiAux=0;
}
Int_t
GetData(){return fiData;}
void SetData(Int_t
dat){fiData=dat;}
Int_t GetTest(){return fiTest;}
void SetTest(Int_t
dat){fiTest=dat;}
Int_t GetAux(){return fiAux;}
void SetAux(Int_t dat){fiAux=dat;}
/* in this example, each module represents single channel of
data.*/
Int_t fiData;
/* module may have test data channel.*/
Int_t fiTest;
/* module may have aux data channel.*/
Int_t fiAux;
ClassDef(TXXXModule,1)
};
The constructor of TXXXModule will pass the name and id number arguments to the TGo4EventElement constructor, thus allowing for composite identification.
The classes TXXXCrate and TXXXUnpackEvent just derive from TGo4CompositeEvent, but do not add any other data members here:
class TXXXCrate : public TGo4CompositeEvent {
public:
TXXXCrate():TGo4CompositeEvent(){;}
TXXXCrate(const
char* name, Short_t id);
virtual
~TXXXCrate() {;}
ClassDef(TXXXCrate,1)
};
class TXXXUnpackEvent : public TGo4CompositeEvent {
public:
TXXXUnpackEvent():TGo4CompositeEvent(){;}
TXXXUnpackEvent(const
char* name) ;
virtual
~TXXXUnpackEvent() {;}
ClassDef(TXXXUnpackEvent,1)
Hence they are
mere data containers to organize the structuring of the TXXXModules. Note that virtual method
Clear() needs not to be implemented in this case, since Clear() of base class TGo4CompositeEvent will invoke all Clear() methods of the composite
components.
The set-up of
components is done in the constructors of TXXXUnpackEvent and TXXXCrate, resp.:
TXXXCrate::TXXXCrate(const char* name,Short_t id) :
TGo4CompositeEvent(name,name,id)
{
if(id <0 || id>XXX_NUM_CRATES)
{
printf("TXXXCrate
id %d outside range!\n",id);
}
else
{
TString modname;
for(UInt_t ix=0;
ix<Config_Crates[id]; ++ix)
{
modname.Form("XXXCrate%d_XXXModule%d",id,ix);
addEventElement(new
TXXXModule(modname.Data(),ix));
}
}
}
//***********************************************************
TXXXUnpackEvent::TXXXUnpackEvent(const char* name) :
TGo4CompositeEvent(name,name,0)
{
TString modname;
for(UInt_t ix=0;
ix<XXX_NUM_CRATES; ++ix)
{
if(Config_Crates[ix]==0)
continue; // skip empty crates
modname.Form("XXXCrate%d",ix);
addEventElement(new
TXXXCrate(modname.Data(),ix));
}
}
Here the static array Config_Crates[] is used to define the set up of crates and modules. In this example it can be changed at compilation time by means of some definitions in TXXXUnpackEvent.h:
#define XXX_NUM_MODULES 16
#define XXX_NUM_CRATES 4
// nr of modules in Crate 0 1
2 3
//
|
| | |
#define NR_MODULES {0,
16, 16, 2}
Definition NR_MODULES will initialize the array Config_Crates[] in TXXXUnpackEvent.cxx, thus defining the actual configuration:
static UInt_t
Config_Crates[XXX_NUM_CRATES] = NR_MODULES;
When writing such event to a ROOT tree with TGo4FileStore enabled, the composite event substructures can be inspected with a ROOT or Go4 treeviewer tool.
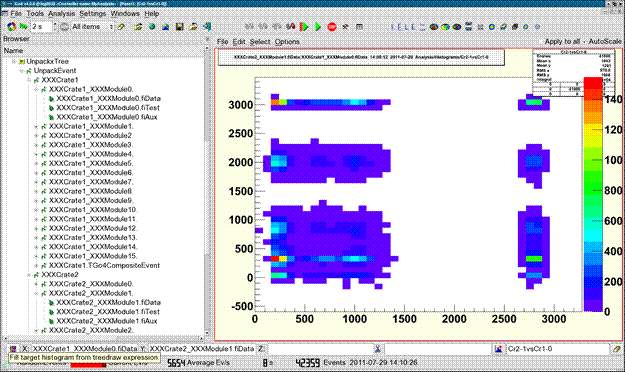
This screenshot picture shows the browser view of a tree produced by the above example. Here Go4 filled a dynamic list histogram from the fiData members of different subcomponents. The hierarchical representation of the composite event leaves in the Go4 treeviewer can be used to easily navigate between different subcomponents. Note that the GUI menu “Settings/Preferences/” provides a mode “Hide TGo4EventElement” to hide all TGo4EventElement leaves in the Go4 treeview. This is useful, since every subcomponent has leaves with members derived from the base class.
10 Icon Table
|
File pad: open local ROOT file on disk |
||
|
|
File pad: open remote ROOT file (TNetFile, TWebFile, TRFIOFile) |
||
|
|
Save content of memory to ROOT file |
||
|
|
File pad: close selected ROOT file |
||
|
|
File pad: close all ROOT files |
||
|
|
Export selected objects of memory browser into another format (ASCII, radware, ROOT) |
||
|
|
Stop running analysis, shutdown analysis and terminate GUI |
||
|
|
Open view panel |
||
|
|
Open fitter window |
||
|
|
Open histogram properties window (there: list properties in analysis window) |
||
|
|
Open histogram creator window |
||
|
|
Open condition properties window (there: list properties in analysis window) |
||
|
|
Open condition editor |
||
|
|
Open event inspector window |
||
|
|
Open dynamic list editor |
||
|
|
List dynamic list in analysis window |
||
|
|
Open parameter editor |
||
|
|
Open browser to (un)load libraries; show list of loaded libraries |
||
|
|
Open user GUI |
||
|
|
Open analysis launch window |
||
|
|
Stop and shut down analysis client, disconnect analysis server |
||
|
|
Stop and shut down analysis server |
||
|
|
Start analysis. Monitor pad: start updating all objects in list, or only displayed ones. |
||
|
|
Stop analysis |
||
|
|
Open analysis configuration window (can be closed/opened any time); browser popup menu: edit selected |
||
|
|
Open analysis output window (can be closed/opened any time) |
||
|
|
Open file browser |
||
|
|
Open color editor |
||
|
|
Expand/shrink histogram in selected pad in X. |
||
|
|
Expand/shrink histogram in selected pad in Y |
||
|
|
Expand/shrink histogram in selected pad in Z. |
|
|
|
|
Move expanded histogram in selected pad in X direction |
||
|
|
Move expanded histogram in selected pad in Y direction |
||
|
|
Move expanded histogram in selected in pad Z direction |
||
|
|
Set fill color |
||
|
|
Set line color |
||
|
|
Set marker color |
||
|
|
Scale Y axis linear/logarithmic |
||
|
|
Scale Z axis linear/logarithmic |
||
|
|
Scale X axis linear/logarithmic |
||
|
|
Draw 1d histogram/line style |
||
|
|
Reset display in selected pad to histogram limits |
||
|
|
Open window to set display limits (applies to selected pad, or all pads if this option is enabled in view panel) |
||
|
|
Execute Tree draw. |
||
|
|
Kill analysis |
||
|
|
Clear button in browser pads clears objects in analysis, in condition editor clears counters. |
||
|
|
Enable clear function for objects |
||
|
|
Disable clear
function for objects ( |
||
|
|
Analysis pad: copy selected object(s) to monitor |
||
|
|
Remove selected object(s) |
||
|
|
Move selected object(s) to memory (from analysis, monitor, or histogram server); or copy object from analysis to editors (conditions or parameters) |
||
|
|
Copy object in editor to analysis (conditions or parameters) |
||
|
|
Analysis pad: update folders from analysis. Memory pad: update all objects from analysis and redraw. |
||
|
|
Browser icons for window condition (arrays). Window mode in marker editor |
||
|
|
Browser icons for polygon condition (arrays). Polygon mode in marker editor |
||
|
|
Browser icon for TCanvas |
||
|
|
Browser icon for TGraph |
||
|
|
Browser icon for Go4 pictures. |
||
|
|
Brower icon for TH3 histograms |
||
|
|
Browser icon for TH2 histograms |
||
|
|
Browser icon for TH1 histograms. Button: draw selected objects (one per pad). |
||
|
|
Draw selected objects (all in one pad, superimpose) |
||
|
|
Save selected object in memory to ROOT file |
||
|
|
Refresh memory list (needed to see new histograms created e.g. by ROOT in the GUI). In condition editor: refresh values from view panel. |
||
|
|
Browser popup menu: open information window for selected histogram or condition |
||
|
|
Editors: shows
up if object in editor differs from object in analysis (file). Use |
||
|
|
Condition editor: connect to a picture with conditions (gets list of conditions from it) |
||
|
|
Condition editor: update graphics from values in editor. |
||
|
|
Output values of condition editor, info window, or markers according settings in the log action. |
||
|
|
Close window without further action |
||
|
|
Browser icon for dynamic list entries |
||
|
|
Insert arrow in marker editor |
||
|
|
Pick next mouse click in pad to get values into condition editor or marker editor |
||
|
|
Browser icon for a tree |
||
|
|
Browser icon for a branch |
||
|
|
Browser icon for leafs |
||
11 Table of Menu and Toolbar Keyboard Shortcuts
Note that the Alt-x keys work on windows whereas the Ctrl (Strg)-x keys work directly. Sometimes the same function is available in both, i.e. Alt-a-n or Strg-n. In these cases the last character is identical.
|
Ctrl-O |
Alt-F-O |
File menu: Open local file |
|
Ctrl-R |
Alt-F-R |
File menu: Open Remote file (TNetFile, TWebFile, TRFIOFile) |
|
Ctrl-Y |
Alt-F-Y |
File menu: Save all objects of memorY browser to ROOT file |
|
- |
Alt-F-H |
File menu: Connect to Histogram server |
|
Ctrl-Q |
Alt-F-Q |
File menu: Close (Quit) all files |
|
Ctrl-X |
Alt-F-X |
File menu: EXit Go4 |
|
|
|
|
|
Ctrl-V |
Alt-T-V |
Tools menu: Open new View panel |
|
Ctrl-F |
Alt-T-F |
Tools menu: Fitpanel |
|
- |
Alt-T-H |
Tools menu: Histogram properties window |
|
Ctrl-I |
Alt-T-I |
Tools menu: HIstogram creation tool |
|
- |
Alt-T-O |
Tools menu: COndition properties window |
|
|
Alt-T-C |
Tools menu: Condition creation tool |
|
- |
Alt-T-E |
Tools menu: Event printout and inspection tool |
|
Ctrl-D |
Alt-T-D |
Tools menu: General Dynamic list editor |
|
Ctrl-B |
Alt-T-B |
Tools menu: Load liBrary dialog |
|
Ctrl-U |
Alt-T-U |
Tools menu: User GUI |
|
|
|
|
|
Ctrl-N |
Alt-A-N |
Analysis menu: LauNch analysis process |
|
Ctrl-C |
Alt-A-C |
Analysis menu: Connect to running analysis server |
|
Ctrl-M |
Alt-A-M |
Analysis menu: Disconnect (reMove) analysis |
|
Ctrl-T |
Alt-A-T |
Analysis menu: SubmiT settings and start analysis run |
|
Ctrl-S |
Alt-A-S |
Analysis menu: Start analysis run |
|
Ctrl-H |
Alt-A-H |
Analysis menu: Stop (Halt) analysis run |
|
Ctrl-G |
Alt-A-G |
Analysis menu: Show/hide analysis confiGuration window |
|
Ctrl-W |
Alt-A-W |
Analysis menu: Show/hide analysis output terminal Window |
|
|
|
|
|
- |
Alt-S-O |
Settings menu: shOw/hide... |
|
- |
Alt-S-F |
Settings menu: Fonts... |
|
- |
Alt-S-Y |
Settings menu: StYles... |
|
- |
Alt-S-L |
Settings menu: Log actions |
|
- |
Alt-S-H |
Settings menu: Generate Hotstart |
|
- |
Alt-S-T |
Settings menu: Analysis Terminal history length |
|
- |
Alt-S-S |
Settings menu: Save Settings |
|
|
|
|
|
- |
Alt-W-S |
Windows menu: CaScade |
|
- |
Alt-W-T |
Windows menu: Tile |
|
- |
Alt-W-C |
Windows menu: Close all windows |
|
- |
Alt-W-M |
Windows menu: Minimize all |
|
- |
Alt-W-O |
Windows menu: Save LOg window to text file |
|
- |
Alt-W-L |
Windows menu: Clear Log window |
|
- |
Alt-W-A |
Windows menu: Save Analysis window to text file |
|
- |
Alt-W-W |
Windows menu: Clear analysis Window |
|
F11 |
Alt-W-F |
Windows menu: Toggle Full screen mode |
|
|
|
|
|
F1 |
Alt-H-I |
Help menu: Read Go4 Introduction manual |
|
- |
Alt-H-R |
Help menu: Read Go4 framework Reference manual |
|
- |
Alt-H-F |
Help menu: Read Go4 Fitpackage manual |
|
|
Alt-H-G |
Help menu: Read Go4 GUI macro command reference |
|
F2 |
Alt-H-Q |
Help menu: About Qt |
|
F3 |
Alt-H-O |
Help menu: About ROOT |
|
F4 |
Alt-H-G |
Help menu: About Go4 |
|
|
|
|
|
|
|
|
|
|
|
|
|
|
|
|
|
|
|
|
|
|
|
|
|
|
|
|
|
Alt-U |
- |
Analysis configuration window : SUbmit analysis settings |
|
|
|
|
|
|
|
|
|
- |
Alt-I-S |
View panel file menu: Save as... |
|
- |
Alt-I-P |
View panel file menu: Print... |
|
- |
Alt-I-O |
View panel file menu: ClOse View panel |
|
|
|
|
|
- |
Alt-E-E |
View panel edit menu: Show/hide marker Editor |
|
- |
Alt-E-R |
View panel edit menu: Show/hide ROOT attributes editor (TGedEditor) |
|
- |
Alt-E-C |
View panel edit menu: Start Condition editor and work on pad conditions (in pictures) |
|
|
Alt-E-E |
View panel edit menu: Show/hide object Event status line |
|
- |
Alt-E-1 |
View panel edit menu: Change to 1:1 coordinates ratio |
|
- |
Alt-E-D |
View panel edit menu: Change to Default pad margins |
|
- |
Alt-E-M |
View panel edit menu: Clear Markers |
|
- |
Alt-E-P |
View panel edit menu: Clear Pad |
|
- |
Alt-E-A |
View panel edit menu: Clear CAnvas |
|
|
|
|
|
- |
|
|
|
- |
Alt-O-C |
View panel options menu: Toggle Crosshair mode |
|
- |
Alt-O-S |
View panel options menu: Show/hide histogram Statistics box |
|
- |
Alt-O-T |
View panel options menu: Show/hide histogram Title box |
|
- |
Alt-O-L |
View panel options menu: Show/hide multiplot Legend |
|
- |
Alt-O-K |
View panel options menu: Keep view panel title |
|
- |
Alt-O-V |
View panel options menu: Set View panel title... |
|
- |
Alt-O-I |
View panel options menu: Toggle SuperImpose mode |
|
- |
Alt-O-X |
View panel options menu: Toggle X-axis time display mode |
|
|
|
|
|
|
|
|
|
|
|
|
|
|
|
|
|
|
|
|
|
|
|
|
|
|
|
|
|
|
|
|
|
|
|
|
|
|
|
|
|
|
|
|
|
F6 |
|
Toggle visibility of browser dock
window |
|
F7 |
|
Toggle visibility of logging dock
window |
|
F8 |
|
Toggle visibility of MBS monitor
dock window |
|
F9 |
|
Toggle visibility of DABC monitor
dock window (only if installed with DABC/DIM) |
|
|
|
|
|
Ctrl-Left: |
|
Zoom tools: Expand range on x axis |
|
Ctrl-Right: |
|
Zoom tools: Un-expand range on x
axis |
|
Left |
|
Zoom tools: Move Histogram left on
x axis (if range is expanded) |
|
Right |
|
Zoom tools: Move Histogram right
on x axis (if range is expanded) |
|
Down: |
|
Zoom tools: Expand range on y axis
(toggles autoscale off) |
|
Up: |
|
Zoom tools: Un-expand range on y
axis (toggles autoscale off) |
|
Shift-Up |
|
Zoom tools: Move Histogram up on y
axis (if range is expanded) |
|
Shift-Down |
|
Zoom tools: Move Histogram down on
y axis (if range was expanded) |
|
Ctrl-End |
|
Zoom tools: Expand range on z axis (toggles autoscale off!) |
|
Ctrl-Home |
|
Zoom tools: Un-expand range on z
axis (toggles autoscale off!) |
|
Shift-Home |
|
Zoom tools: Move Histogram up on z
axis (if range was expanded) |
|
Shift-End |
|
Zoom tools: Move Histogram down on
z axis (if range was expanded) |
|
Ctrl-Minus |
|
Zoom tools: Un-zoom ranges totally |
|
Ctrl-Plus |
|
Zoom tools: Show/hide range
settings window |
|
Ctrl-Star: |
|
Zoom tools: Apply auto zoom (adjust range to show non-zero region only) |
|
|
|
|
|
F5 |
|
Browser options: refresh all displayed objects |
|
Shift-C: |
|
Browser options: Clear all
remote histograms remotely |
|
Shift-M: |
|
Browser options: Monitoring on (start timer) |
|
Shift-N: |
|
Browser options: No monitoring
(stop timer) |
12 Event Classes Diagrams
The following UML scheme gives an overview of the event
base classes and typical implementations:
The TGo4MbsEvent is filled from the TGo4MbsSource
(both provided by Go4). The TUserEventProcessor, which had been defined
to match the user’s experiment, takes the raw data from GSI format 10,1 and
unpacks them into the TUserEvent object. Both TGo4MbsEvent and TUserEvent
objects can be stored into (different) TGo4FileStore instances. Later
these can be read again event-by-event using the TGo4FileSource.
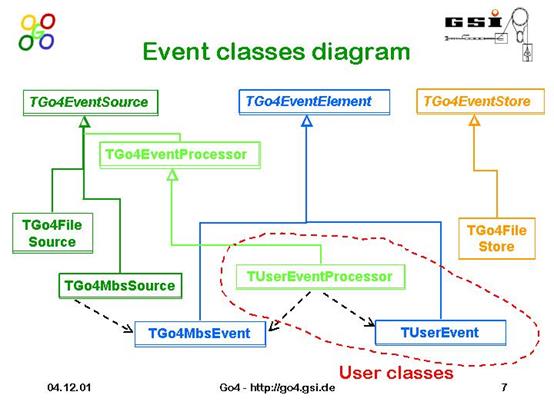
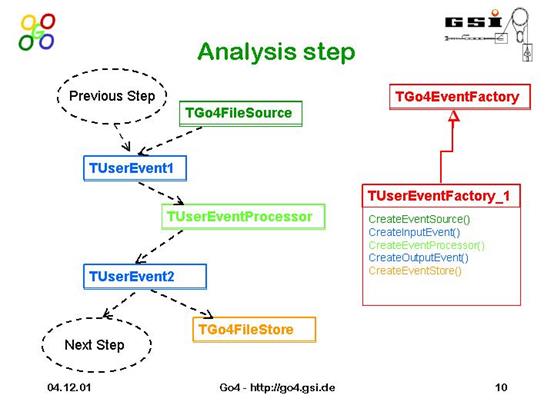
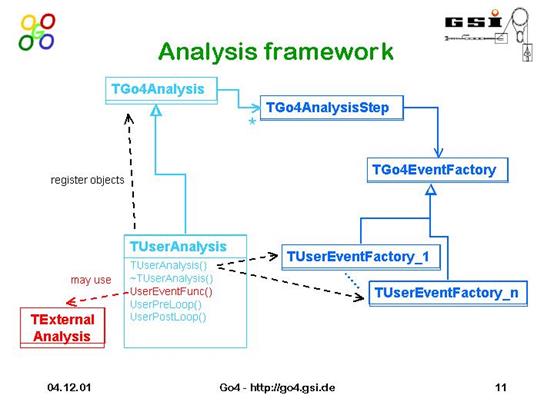
13 Release Notes
13.1 New features in Go4 v4.6 (November
13)
1.
Analysis
runtime environment:
1. New printout option for go4analysis:
"go4analysis -print bhead fhead" will print lmd buffer and/or file
headers together with the event headers. Additionally, most recent time string
from buffer header is printed together with event header
2. Allow to specify port number for any
MBS source (beside file) in form name:port like calling "go4analysis
-stream node:6543". Useful for virtual desktops (vnc) where ports around
6000 are blocked. Same can be done in gui.
3. Add retry counter for some MBS
sources - let reconnect server if it was down for some time. Useful for online
analysis when server can be switched off/on very often for short time.
Implemented in MBS source class, can be configured in go4analysis, qt3/at4 gui,
hotstart.
4. Allow to specify several files in
row as argument of command "go4analysis -file ..." It is very useful
in the case when wildcard characters are used. Shell automatically expands all
wildcards itself and therefore previous go4 versions get errors. Now following
command is valid: "go4analysis -file *.lmd". Make debug output of the
analysis more clear when processing many files.
5. Add -rate argument to the go4analysis
executable. Enables output of current rate in batch mode.
6. Added support for x-axis time
display in TGraph and TH1. New Items in Viewpanel Options menu: "X-Axis
displays time" and "Set xaxis time format"
2.
Analysis
framework and API:
1. Add ExecuteScript() method to
analysis and event processor. Simplifies usage of macros in user code.
2. Add in MakeParameter method
possibility to execute setup macro In GetParameter method one could optionally
specify class name, which will be verified
3. Allow to use TArrayI and TArrayD in
the TGo4Parameter and parameter editor. Now parameter elements of such classes
can be edited and store in script
4. Introduced event processor API
methods SetKeepInputEvent() and SetKeepOutputEvent() to provide "1 to n" and "n to
1" event building functionality. To be used if input event contains
several output event data sets, or vice versa if several input events must be
processed to gain one output event. Each time these methods are called in event
processor, the next analysis cycle will skip all previous, or all subsequent
analysis steps, resp, and will reprocess the input, or continue filling the
output event data, resp.
3.
Go4
GUI:
1. Provide in preference menu
possibility to set "draw once" flag. Means every histogram can only
be drawn once when double-clicked in the browser.
2. Implement auto-zoom functionality
for 1/2/3-dim histogram (qt3/qt4). Automatically adjust range selection to
non-zero content of the histogram. Can be actiavted also with Ctrl * keys
combinations. Thanks to Michael Traxler for nice idea.
3. Added some keyboard shortcuts for
histogram display manipulation:
·
Ctrl-Left/Ctrl-Right:
Expand/Unexpand range on x axis
·
Left/Right: Move Histogram left/right on x axis (only if
range was expanded)
·
Up/Down:
Expand/Unexpand range on y axis (toggles autoscale off)
·
Shift-Up/Shift-Down:
Move Histogram up/down on y axis (only if range was expanded)
·
Ctrl-End/Ctrl-Home:
Expand/Unexpand range on z axis (toggles autoscale off)
·
Shift-Home/Shift-End:
Move Histogram up/down on z axis (only if range was expanded)
·
Ctrl-Minus:
Unzoom ranges totally
·
Ctrl-Plus:
Show/hide range settings window
·
Ctrl-Page
Up: Y axis in logarithmic scale
·
Ctrl-Page
Down: Y axis in linear scale
·
F5:
Refresh display of all remote Histograms
·
Shift-C:
Clear all remote Histograms remotely
·
Shift-M:
Start monitoring timer
·
Shift-N:
Stop monitoring timer
Note: All these shortcuts do work only if the
corresponding toolboxes (zoom tools, browser options, short histogram draw options)
are active!
4. Added shortcut F1 to display the Go4
Introduction Manual as Help.
5. Added shortcuts F6, F7, F8 to toggle
visibility of browser, logger, and mbs
monitor dock windows (F9 for DABC monitor if compiled with DIM)
6. GUI analysis status ratemeter:
Tooltip of runtime seconds this time as
hour:minute:seconds representation.
7. Graphical Markers and Conditions:
Added possibility to define a "printf style" format string in for the
float number display in marker/condition label box (default is %.4E). When
selecting the marker/the condition display on TPad via mouse button, the ROOT context menu provides method
SetNumFormat(const char*) to change the settings of current marker. Context
menu function SaveLabelStyle() will set current format as default for all markers/conditions.
MainWindow menu "Settings/Panel Defaults/MarkerLabels..." also has new field to set this format string.
These defaults can be saved to go4 settings.
8. Add full-screen mode for main window
(F11). Both for qt3 and qt4
9. Add possibility to change default position of
stat box (only for qt4 gui)
10.
Add
support of composite events in dynamic list editor (qt3/qt4)
4.
Introduced
several functionalities from DABC framework classes:
1. To get different DABC functionality
to go4, one need to compile go4 with "make withdabc=1" flag. One
should use newest dabc version (>= 2.6.0) from repository.
2. Provide a http server within
go4analysis: Just add "-http
8090" arguments to start web server, which can deliver all go4 objects to a
web browser. This provides go4 analysis view in web browser similar to the go4 GUI. Commands like start/stop analysis and
clear histograms are available via the web interface.
3. Possibility to optionally connect go4
analysis with a DABC “master node”,
which can export go4 data via http
server. By this data from many go4 analyses can be aggregated in the same
server.
4. Optionally open direct communication
channel from go4 GUI to a DABC node to access objects. Idea is to have similar
look and fill like web-based interface, but with native ROOT graphics in Go4
GUI.
5. In GUI Analysis Launch Panel one can
specify arguments to start http server or to connect with master DABC application.
6. Support of connection to dabc in gui
and hotstart (qt4)
5.
Hotstart
and GUI scripts:
1. Provide configurable timeout in hotstart
script for time when analysis configuration is submitted. It can be longer as
default 20 sec, which now can be changed.
2. Add possibility to refresh names
list after analysis configuration. Can be used if shortly after analysis start
new histograms are created, which should be shown in the gui. For that one need
to add following lines to the hotstart:
go4->Wait(10); go4->RefreshNamesList(); First wait defines
how long one need to guarantee, that analysis starts.
3. Provide in gui script possibility to
request item name, drawn in the panel. Method name is
go4->GetDrawnItemName(panel, cnt = 0). Can be useful in some gui scripts.
Done for qt3/qt4.
4. Added macro fft.C for fast fourier
transform of histograms into gui command line.
6.
Adjustments
for ROOT 5.99 development version.
7.
Many
small code bugfixes and adjustments for most recent OS and root versions.
13.2 New features in Go4 v4.5 (July 11)
.
- Implement Ctrl-C handler for go4analysis
executable. This will close analysis properly. If go4analysis runs under gui control: After
first Ctrl-C analysis will try normally finish event loop and exit. After
second Ctrl-C it tries immediately store autosave file and exit. All
consequent Ctrl-C will just terminate analysis.
- Implement -print argument for
go4analysis program. This allows to print any kind of event on the
terminal - even without actual user analysis. For instance: go4analysis -stream r4-4 -number 10 –print will print 10 events from MBS stream
server r4-4. Print also works with user source.
- Significant changes in event
classes. Reincarnation of TGo4CompositeEvent.It is now can be used again
as output/input of any step. Many errors are fixed.
- Add possibility to hide
TGo4EventElement members from tree viewer and even viewer. This makes look
of data structures, especially in composite events, much more clean.
Default is off, can be changed via Settings->Preferences menu. Implemented
for both qt3 and qt4 version.
- Add TGo4CompositeEvent
structure to example Go4ExampleAdvanced.
- Default implementations for
TGo4Parameter methods are provided. Now Clear(), PrintParameter() and UpdateFrom()
methods have meaningful functionality and can be used as is in user
derived classes.Thus, it is possible to declare user parameter class
without any additional methods.See Go4ExampleSimple and Go4Example1Step.
- Add support of arbitrary
objects in TGo4Picture::AddSpecialObject, show real picture size in the
browser
- Add possibility to specify wildcard
in TGo4EventSource class - allow to treat many subsequent root files, improve
wildcard treatment in TGo4MbsFile, provide wildcard functionality for
Windows.
- Added possibility that output
event of first analysis step can be declared as MbsEvent and just save the
incoming mbs event into ROOT tree without copying the data: added method
TGo4MbsEvent::AssignReference() allows to use TGo4MbsEvent as a "reference"
to another TGo4MbsEvent; added constructor TGo4MbsEvent(const char*) to
use it with standard factory
- Add to TGo4Analysis static
methods IsBatchMode(), IsClientMode(), IsServerMode(), returning running
mode of the analysis. Variable is set in go4analysis program and therefore
methods can be used already in user analysis constructor
- Adjusted to new version of
gSTORE RFIO/ lmd event input (RFIO v6.0)
- Implement
TGo4FileStore::SetMaxTreeSize method to let configure size of created tree.
Add -maxtreesize argument to go4analysis to change value in batch.
- Add possibility to
display/monitor TLatex object from analysis (qt3/qt4).
- Keep and restore panel name in
hotstart file.
- Allow to configure default draw
options for classes like TH1/2/3, TGraph
- Provide meaningful
implementation for TGo4Analysis::SendObjectToGUI method. Now user can send
any registered object (histogram, graph, condition) to gui, where it will
be automatically updated. If object displayed, viewpanel will be updated. This
allows do histogram monitoring without activating monitoring mode.
- Optional polygon condition in
projection macros
- Use 64-bit integer for analysis
loop count. Display correctly number of processed events in gui.
- Add possibility to select font
in analysis window. Sometimes it is useful to set fixed-size font there to
see better formatted output from analysis.
- Use gStyle->GetStatFormat()
for formatting of fitter parameters output.Add possibility to configure
this format from GUI via Settings/Panel defaults/Printf menu.
- Autosave file performance: for complex
directory structures, it took sometimes minutes just to open it during
analysis start.Normally analysis reads histograms in the beginning (when
autosave enabled) and file was opened in "update" mode. When
closing such file, ROOT writes complete directory structure back to the
file, which may takes minutes. Therefore, for reading autosave will be
opened in "read", when writing "recreate" will be
used.
- Windows version: Adjust to Microsoft
Visual Studio 2010. Support UserGUI in Win32, solve windows export/import
problems. Fix error with user source example under Windows.
- Support of MacOS X (Darwin).
Still experimental.
13.3 New features in Go4 v4.4 (November 09)
- Add clear histogram and conditions button in gui
- System configuration tested
once and stored in $GO4SYS/build/Makefile.gener file. This simplifies
compilation of user analysis and excludes misconfiguration.
- Makefile
logic improved to be able work with system-wide installed ROOT version - ROOTSYS no longer required to be
set. Instead root-config script should be always available via PATH
variable.
- ROOT/Qt/Go4 library paths
directly specified in all go4 executables (go4, user analysis). This
speeds up start time and allows to run
gui and analysis without any login scripts. To disable this
compilation option, during compilation call "make
rpath=false"
- Introduce standard go4analysis executable, which can be used to launch any
user analysis, loading it from the user (typically libGo4UserAnalysis)
library. Minimum changes required - user should implement CreateUserAnalysis()
function. ExampleSimple, Example1Step, Example2Step adjusted to this
scheme.
- Introduced go4-config utility,
which provide possibility to use go4 without setting environment variables
like GO4SYS or LD_LIBRARY_PATH. The only requirement is that go4-config
should be accessible via PATH variable or should be placed in one of the
standard locations.
- New install capability in makefile. One can compile complete go4 with
command "make prefix=/usr/local", where prefix variable defines
installation directory. After compilation completed, "make
install" command will copy binaries in bin/, libraries in lib/,
includes in /include/go4 and other additional staff in share/go4/ subdirectories.
After installation it is enough just provide PATH variable to bin/
subdirectory to be able fully use go4 GUI and compile user analysis. To use
such installation in old makefiles, GO4SYS variable should be defined and
point to share/go4/ subdirectory. Or one can slightly modify old makefile,
specifying there GO4SYS=$(shell go4-config --go4sys) - see standard examples.
- go4 gui can be started with
"-observer", "-controller", "-admin"
arguments, followed by optional
hostname [localhost], port number [5000] and access password [none] which
defines running analysis server. This simplify gui handling when running
analysis from other shell. Especially useful when running analysis with
go4analysis executable like: “go4analysis -server -stream mbshost"
- From gui one can launch analysis without shell,
just with simple exec command. This solves problem, when ssh requires
running DNS even when launching analysis on the same node. This also
allows to launch analysis from windows gui.
- Logic how analysis started from
the gui is completely changed. Instead of two intermediate shell scripts
analysis executable called directly. All shell/terminal/initialization
settings for such command collected in etc/go4.prefs file. User allowed to
create its own go4.prefs file in current directory to redefine some
settings. With conditional syntax one can define host/OS specific
configuration how is analysis started. This approach allows run go4
analysis on the nodes with completely different OS/software settings. Old
scheme (via AnalysisStart.sh scripts) can be activated by setting export
GO4OLDLAUNCH=yes variable before gui start.
- Allow to run analysis, compiled
into library, from the gui. Example simple, 1step and 2step shows how it
can be done. From this point on it is no longer necessary to have
MainUserAnalysis executable at all.
- Signal handler is used to normally stop analysis by Ctrl-C pressing from the user
- stop processing, close connections, save autosave file.
- Support TGraphPolar in draw
options selection.
- Make default location for setting
account wide, one should define GO4SETTINGS=LOCAL to store/use gui
settings from current directory.
- Simplify event source handling
in user code. It is no longer required that event class 'knows' all its
possible sources - only source itself decides which event class and how it
fill. Cleanup all sources class in go4 and examples. Old code will work as
is.
- go4analysis executable search
user library for new classes and create user analysis instance, using
predefined signatures: (const char*) or (int, char**). Constructor signature (int, char**) like for main()
function allows to deliver arbitrary arguments to user code (see
Example2Step). If standard signature not found, any non-default
constructor will be tried - most old examples and codes should work.
Alternatively, one can define CreateUserAnalisys(const char*) function to
create analysis instance.
- Improve saveparam.C and
savecond.C macros - better readable code. SavePrimitive() methods are
used, implemented for parameter and condition classes. New saveall.C macro
to store all conditions and parameters in single macro file.
- Fix error with connecting
DABC/MBS servers second time
- Fix error (introduced in
v4.3.0) with using autosave files - object was not found correctly there
- Set green/red color in analysis
status monitor widget
- In qt3 version exclude all gui libraries,
integrating code in executable (similar to qt4)
- Suppress symbolic links in user
gui library to avoid compilation problem on DOS partitions, where links
are not supported
- Workaround for TCutG API
changes in ROOT 5.25.1 and further
13.4 New features in Go4 v4.3 (June 09)
- Remove Q3Support classes
completely - now Qt4 based GUI is pure Qt4 application. This solves many
side effects like crash by style changing or blinking during resize of
main window. From this version on Qt4 GUI is default.
- rootmap files are generated per
library - this simplifies make procedure significantly, old user makefiles
are still working
- Go4 makefile now can better
recognize standard installed Qt version without QTDIR set. 'make WITHQT=3'
or 'make WITHQT=4' forces usage of specified
Qt version.
- Fix problem with drawing of
THStack from canvas or file.
- Add proxy for THStack to be
able browse into THStack and draw single histograms from it
- Better autoscale of THStack class
- Ensure that drawing of
histogram first time done only once, in case of 2D histograms doubles the
performance
- When running GUI, one can
specify one or several root files, which will be loaded automatically
- BUGFIX: GUI was hanging when
non-existing hotstart file was specified.
- New MakeTH1, MakeTH2,
MakeWinCond, MakePolyCond, MakeParameter methods in TGo4EventProcessor
class are implemented. They provide easy way to produce analysis objects
or take them from the autosave file. See analysis examples how these
methods can be used.
- Examples only have Makefile, no
Module.mk any more.
- Make "COL" as default
option for 2-D histogram, improves significantly speed for large
histograms, one can always goes back to scatter plot
- Analysis, running inside GUI,
runs without DISPLAY variable set (ssh -x). If any graphics required in
analysis, one should run it in separate xterm/konsole application, where
ssh -X is done.
- After Go4 built, one can call
"make clean-bin" to remove all object and dependency files, but
executables and libraries will remain. Useful for installation. Now one
can compile (but not run) Go4 without Go4SYS set.
- Histogram title position is now
preserved and restored when histogram is updated.
- Solve problem with flickering
widgets in Qt4 GUI.
- Make Go4ExampleSimple really
simple - no more complex parameters or initialization. Main executable is
now more flexible when specifying command line arguments.
- When new view panel is created,
it should always fit into current main window - before one can get view
panel which two time larger.
- Go4 event loop optimization -
simple analysis with GUI runs 10-20% faster than before.
- Configuration of Qt4 GUI is
stored by default in current directory in go4.conf file. One can do
"export GO4SETTINGS=ACCOUNT" to store GUI settings in
account-wide location.
- Replace "disable" by
"enable" check boxes in analysis configuration - makes
configuration more intuitive. Shortcut of each step configuration can be
seen together with step name on the top of analysis configuration panel.
- Provide better log output when
Go4 open/change/closes lmd/root files in analysis. End of ROOT file no
longer results in ERROR exception, but in End of File exception.
- Automatic stop after specified
number of events. For all MBS event sources an event count can be set in
configuration panel after which the analysis is stopped and can be
continued for the next number of events. The current values for files
specify start and end event number as found in the event data. Often this
event number starts not from 0 and is even rather unknown. In addition it
does not allow for stepping through a file. Note that an event function
can stop the loop by throwing TGo4EventEndException(this) (TGo4EventEndException.h
must be included).
- For multiple plots he canvas division
is taken from the values given in the canvas widget. If these values do
not fit, take defaults as now.
- Tree browser: Several
enhancements make usage much better: After dragging an item into the tree
viewer field, focus is set into that field, because most probably one has
to modify the index. A RET in that field triggers the browser. Dragging a
field and RET accumulates over all indices. TABs move to next input field. Histograms
can be cleared in workspace.
- BUGFIX: Adding histograms to an
superimpose enabled canvas changed colour only once to red, all following
black. Selecting histograms and superimpose in new plot showed different colours as expected. Fixed.
13.5 New features in Go4 v4.2 (April 09)
- Merge Go4 version 3 with Go4
version 4 together - now same package can be compiled either with Qt 3.3
or Qt 4.4.x. Version of Qt can be selected by setting proper QTDIR path.
If QTDIR is not set, default version will be used (if any)
- Replace html documents by pdf,
use external pdf viewer for them.
- Reduce usage of qt3support
classes in Qt4 part of GUI.
- Add in Go4Example2Step example
of TGo4Fitter usage
- Few more options can be set in
TGo4Picture: SetStatsAttr, SetAxisTitleFontSize,
SetAxisLabelFontSize,
SetTitleAttr;
13.6 New features in Go4 v4.1 (October 08)
- New toolwindow DABC Monitor: For new GSI DAQ framework Data Acquisition Backbone Core. Allows
to inspect all info services registered to any DIM server. Any DABC
ratemeter service running on DABC
or MBS nodes may be monitored and filled into trending and statistic
histograms. This tool is build optionally if environment $DIMDIR is set and DIM is installed
there.
- Added Support of Solaris with CC 5.x (without RFIO). Fixed different warnings
from Solaris CC compiler.
- Viewpanel menu: "File/Produce Graph From Markers" will generate new
TGraph in local workspace containing the points of all Go4markers set in the current pad. May be
used to fit function to manually selected positions.
- Bugfixes:
- Viewpanel canvas was not working with Qt >= 4.4.x (empty widget with grey
background) because Qt workspace may change X-window id at runtime.
Improved Go4QtRoot interface classes to reset winId
dynamically on resize. Modified rendering of TQRootCanvas to avoid
unnecessary Qt double buffering.
- Viewpanel embedded TGedEditor
was sometimes not displayed at startup. Improved Go4QtRoot interface to avoid extra Resize() in
TQRootWindow::paintEvent which may lose coordinates of primary editor tab.
- "Settings/Style" menu would crash GUI sometimes due to unresolved
problems in QtApplication::setStyle when called at application runtime. Workaround: menu
will select style for Go4 settings,
style is no sooner activated than on next startup.
- "Settings/Fonts..." menu would crash GUI sometimes due to unresolved
problems in QtApplication::setFont when called at application runtime. Workaround: menu
will select font for Go4 settings,
font is no sooner activated than on next startup.
- QGo4Settings is not working correctly anymore with Qt>4.4 due to modifications in QSettings API
and Qt settings location. Now general settings must always be kept at $HOME/.config/GSI/.go4.conf and can not vary for different directories
in the same account. However, the
main window toolbar setup may still be saved locally (at $PWD/.config/GSI/go4toolsrc, default),
or account specific (at $HOME/.config/GSI/go4toolsrc
). This is selected as before by setting environment variable GO4SETTINGS="ACCOUNT".
- Mbs API:
streamserver connection timeout was not working correctly (leads to hangup of analysis
control when no data is delivered from streamserver).
- Mbs API:
several errors at reading of *.lmd files with new event format 100,1
(DABC)
- MbsAPI ,
for f_stccomm.c file. Fixes problem with connecting 64 bit machine to MBS
events/stream/trasnport server. False usage of select() function.
- TreeViewer swapped x/y/z coordinates, convention is
TTree::Draw("z:y:x"))
- Viewpanel: "Produce Picture" did not save all draw options to
picture
- Viewpanel: Mismatch between Go4 viewpanel range (full visible range) and
ROOT user range (referring to low edges of bins) could cause slight shift
of x axis range on canvas refresh
- Maintenance:
- Modifications in makefiles -
now only in one place in Makefile.config one should specify platform -
Linux, Solaris or Win32. Other small changes in makefiles
- Adjustments for modifications
in ROOT signal-slot mechanism syntax (ROOT >=5.19/02); this caused viewpanel
crash.
13.7 New features in Go4 v4.0 (February 08)
1.
Ported the Go4 GUI for Qt Version 4.
This includes the main Go4GUI, the Go4UserGUI example, and the GSI qtroot
interface with the Go4 extensions. Notes:
a.
Go4
v4 REQUIRES Qt3support libraries of Qt4 installation
(should be the configure default).
b.
Go4 v4 needs to disable the XInitThreads() in ROOT
TGClient initialization to avoid
conflicts between ROOT X11 graphics and Qt4.
This is only possible for new ROOT versions that support to switch the X11.XInitThread resource by
environment settings (thanks to Fons Rademakers!).
=> Go4 v4 REQUIRES ROOT VERSION
> 5.19/01
c.
Go4 v4 will not
work anymore with Qt Versions 3.x. To use Go4 with Qt3,
please install Go4 versions 3.03.0x which will still be supported in
parallel.
2.
Mbs
event library: Added new event types for future GSI data
acquisition framework DABC.
- Viewpanel: Correct work of marker class in case of superimposed histograms. Now
newly created marker will be assigned to currently selected histogram.
- FitPanel:
in Wizard and Expert mode there is now possibility to clone existing model component.
Especially usefull in case of TGo4FitModelFunction and TGo4FitModelFormula
classes, which require a number of different settings.
5.
Bugfixes:
a.
TGo4Browser: Arrays fVisibleColumns and fIndexes has 1
item less than required.
b.
QRootApplication: in constructor numc argument must be
delivered as reference.
c.
TGo4MBSViewer: status record must be cleared in
constructor.
d.
Fit package concerning parameters handling when
some parameters are fixed
e.
MbsAPI , for f_stccomm.c file. Fixes problem with
connecting 64 bit machine to MBS
events/stream/trasnport server. False usage
of select() function.
6.
Maintenance:
a.
Small
adjustments for the new ROOT (5.17.05) browser.
b.
Two
ROOT libraries (libTree and libGpad) added to Go4 rootmap file that user Go4
analysis library can be loaded in CINT session.
c.
ThreadManager
workaround for ROOT bug in TThread::Delete() (ROOT bug report 31085): for some compilers, Go4 GUI crashed when shutting down or disconnecting analysis.
13.8 New features in Go4 v3.3 (May 07)
1.
Viewpanel
a.
Marker
editor: A point- or region marker and its label will pop to the pad foreground when it is selected
with left mouse button. Additionally, selection of a marker in the combo box of
the editor will let it appear frontmost.
b.
In superimpose mode selected histogram can be moved on the top of complete histogram stack via new
menu command "Select/show histo on top".
c.
Draw
options enhanced: support for TGraph draw modes and TGraphErrors
error style. Reorganization of draw options for TH1/TH2. New draw options tool
for line, marker, and fill colours of histograms and graphs.
d.
Menu
"Select" to chose active object from superimposed histograms
and graphs.
e.
Autoscale
checkbox as shortcut on top of each viewpanel
f.
Improvement
in speed of view panel redraw (up to factor of 2).
2.
Fitpanel
improvement: keep y-scaling when fitting on x subrange of histogram
3.
New
Zoom toolbar: added buttons for scaling z-axis of 2d histograms.
4.
New
icons for zoom toolbar and draw options toolbar.
5.
New
additional draw options toolbar to select commonly used drawing options by
buttons (lin/log, line, histo, some 2d styles). The new toolbar is displayed
via the RMB options pull down menu.
6.
New
example macro scalex.C to scale x-axis of histogram with linear calibration
function
7.
Settings
menu: "Show event status" selectable as default
pad option.
Settings menu: "Statistics Box..." dialog to define default pad
options for histogram statistics.
8.
TGo4Picture:
new method AddSpecialObject()
to add any ROOT graphical object (text labels, markers) to the picture
9.
Improvement
in TGo4MbsFile
for partial read of lmd file: Corrected mismatch between first event index and
real event number (before: index=event number-1).
10.
TGo4MbsFile:
now can also read list-mode data of old event formats type 4,1 and 4,2. Event
will be converted implicitly into format 10,1 for further processing: User
unpack processor gets TGo4MbsEvent with one TGo4MbsSubevent that contains all event data.
11.
GUI
command interface TGo4AbstractInterface. Added methods:
- GetViewPanelName() -
returns view panel name
- SetViewPanelName() -
changes view panel name
- RedrawPanel() -
updates view panel view
- RedrawItem() -
updates all views of specified items
- FindViewPanel() - searches
for view panel of specified name
- GetActiveViewPanel() -
returns currently active view panel
12.
Maintenance:
a.
Some Makefile and build skript improvements
b.
Added missing includes for <math.h>, required by
some compilers
c.
Due to changes in ROOT in many Go4 files includes like
TROOT.h, TMath.h, TList.h
are missing. Sometimes user should also include these files in user code.
d.
In latest ROOT TBuffer class becomes abstract,
therefore one cannot use it directly in the code. Instead, TBufferFile
class must be used.
e.
Adjustment of Makefile
because of changes in default libraries for ROOT >= 5.13/04 (separated
libSpectrum.so)
f.
Adjusted Go4ThreadManager package due to changes in TTimer copy constructor for ROOT
versions > 5.12.00
g.
Some bug fixes concerning compilation against old ROOT
versions 4.08
13.
Bug
fix
a.
for changes in ROOT>v5.14 pad cleanup: Viewpanel with go4 markers on subpads crashed
when closed or cleared.
b.
1-d histogram drawing. Due to some features of ROOT
histogram painter several draw options (lin, barchart and others) not working
after TH1::SetSumw2()
is called - in there Sumw2 array sum of squares of weights is accumulated.
Modification in Go4 code were done to avoid Sumw2 arrays when it not necessary.
c.
in Go4Socket library (missing include) because of
changes in ROOT version 5.14-00
d.
Problems with view panel scaling functionality when
build with gcc4.0.x compiler (FC5); fixed.
13.9 New features in Go4 v3.2 (July 06)
1.
Analsis framework: TGo4EventElement now implements default method Fill() that calls virtual function TGo4EventSource::BuildEvent(). As a consequence, for a simple analysis
the user only has to implement BuildEvent() method in his processor class. There is no need to develop a user
output event class. Even if a user output event class shall be used, methods Fill() and Init() are not necessarily needed for a standard analysis. Go4ExampleSimple and Go4Example1Step were changed accordingly.
2.
Analysis framework: TGo4EventProcessor now implements BuildEvent() and can be used in steps which are only used as
handle for event input (branched steps).
3.
Macro usage: Analysis defines __GO4ANAMACRO__ on startup to be used in any Go4
analysis script to check the current environment. In GUI, __GO4MACRO__ is defined and can be checked
analogously. In analysis, pointer go4 is already set to TGo4Analysis::Instance(), in GUI to TGo4AbstractInterface::Instance(), i.e. all methods can be referenced by go4->. (see 5.4.3, page 42, and 5.17, page 75)
4.
Parameter editor offers popup menu GetFromFitPanel for embedded fitters to update fitter
settings from the current fit editor. Useful for calibration parameters that
should be fitted interactively to spectra (see Go4Example2Step).
5.
Rebin in GUI. Now when histogram will be rebinned via
right-mouse menu or via ROOT graphical editor, rebinning will be kept when
histogram will be updated next time from analysis. Many views of the same histogram
with different binning are possible. Binning also kept in hot-start file. TGo4Picture has new SetRebinX(), SetRebinY() methods to
configure rebinning of displayed histogram.
6.
All Go4 macros put into new subfolder $GO4SYS/macros. This directory should be added to
entry Unix.*.Root.MacroPath in .rootrc setup file.
New macros: savecond.C and saveparam.C to create macros to set conditions and
parameters to their current values (see 3.4.2, page 12).
7.
Bugfixes:
a.
Access to RFIO root
files from Go4 GUI browser was not possible (at GSI), since internal functions
of libRFIO.so were shadowed by functions of GSI event lib with same names. Solved by separating
Go4 event library package into different modules for analysis and GUI task.
b.
Analysis server
executed UserPostLoop() each time a GUI client was disconnected.
Disabled.
c.
Several changes
concerning the cleanup mechanism in GUI object manager
d.
AnalysisClient in CINT mode
showed thread deadlock for ROOT versions> 5.02-00
e.
Start client dialog
selects correct analysis directory when choosing the analysis executable
13.10 New features in Go4 v3.1 (May 06)
1.
New script
command line widget for GUI: Allows execution of ROOT commands or macros
within Go4 GUI task. Moreover, Go4 hotstart scripts may be invoked here at any
time. The widget offers a file dialog to search for *.C and *.hotstart files.
It also has a selector dialog of preloaded commodity functions for histogram
manipulation (rebinning, addition, projection, etc.). These function template
calls may be completed with existing histogram names by dragging histogram
items from the browser and dropping them on the empty command argument. The
history of the command line may be saved to the current Go4 settings file .go4/go4localrc
and is then restored on next startup. (See 5.17, page 75).
2. New
GUI command interface class TGo4AbstractInterface.
It can be accessed by handle "go4->" in
GUI command line. This makes it possible to interact with Go4 GUI views and
browser objects in a ROOT/Go4 script. Additionally, all remote analysis control
commands are available here, like in the hot start scripts. Method reference of
TGo4AbstractInterface
is available in the Go4 help viewer (type "help" in GUI command line,
or use Help►GUI commandline menu of
Go4 main window). Example scripts using
this interface are at $GO4SYS/Go4GUI/scripts
(definitions of the preloaded command line histogram functions). Note: have been moved to $GO4SYS/macros in V3.2.
3.
New general
marker label settings dialog. In main window menu Settings►Panel Defaults►Marker labels..,
a checkbox dialog offers to switch all label properties of the region and point
markers (visibility and information displayed in the label). These settings
have effect on all new markers of the view panel marker editor. They are saved
in the go4 preferences file .go4/go4localrc. (see 5.7.7, page 58)
4.
Plain
ROOT canvases in files are better displayed.
5.
New settings feature Settings►Preferences►Fetch when saving. If
enabled, the save
browser / save memory button of the file toolbar will refresh all browser
item objects from analysis before saving. Thus the ROOT file will contain a
snapshot of all analysis objects. Otherwise, only the already fetched objects
are saved.
6.
Zoom
tools "set scale" dialog upgraded to non modal MDI
widget. This will appear always on top of workspace widgets and refers to
currently selected view panel pad. Changes include some bug fixes concerning
the range settings of 2d histograms, and the auto-scale property.
7.
MBS
monitor tool: If monitoring switched on, calculation of rates is now
done in Go4, averaged over update time. Parameters of MBS monitor are stored in
Go4 settings file.
8.
TGo4Interface:
new method ExecuteLine
to remotely do CINT call from Go4 master process in the remote slave process
9.
View
panel superimpose mode improvements:
a.
is not changed anymore after superimposed draw of
FitPanel results, i.e. fitter data histogram can now be replaced just by drag
and drop on the view panel
b.
existing axis labels of first histogram are kept
10.
FitPanel
settings are saved/restored in go4 settings file
11.
Fit
GUI: Enhanced draw styles for TGraph
12.
Bugfixes:
a.
Workaround for ROOT crash in histogram rebin editor:
Selecting a histogram in view panel for rebin with the ROOT attributes editor
leads to segmentation violation when original histogram was replaced or deleted.
b.
Crash
in Go4 markers/conditions when histogram in view panel was replaced by drag and
drop.
c.
Update of histogram in GUI failed when histogram
dimensions (ranges) were changed in analysis
d.
Position and size of histogram statistic label may now
be saved in Go4 picture objects. Thus these properties can be restored on Go4
hot start.
e.
Crash
on closing last non-minimized window in view panel
f.
Problem
with empty TGraph
as data source in Fitter
g.
Crash
when FitPanel histogram under work was replaced or deleted in view panel. FitPanel
did not react automatically on changes, happening with histograms (or graphs),
displayed on view panel. Therefore, when superimpose mode was switched off,
fitted histogram disappeared from view panel (and also deleted), while fitter
still has pointer on that histogram. Now FitPanel slot in object manager registered also against all
histogram, used in fitting. If histogram is deleted, FitPanel will be automatically refreshed.
h.
Histogram title could not be switched off in
superimpose mode in view panel
13.
Improvements in make files
14.
Adjustments of includes due to changes in new ROOT
version 5.10
13.11 New features in Go4 v3.0 (November 05)
- Redesign of the GUI with new internal object manager. Decoupling of controlling functionality from the Qt graphics layer. Effects many of the following features.
- New Go4 browser. Instead of several tabs for remote analysis, local memory, monitoring list, now one browser with sub-branches for different data sources, such as remote analysis, histogram servers, root files, is used. Supports local memory workspace folder with copy and paste by drag and drop, clipboard, and renaming. All controls available via right mouse button context menu. Switchable columns for object properties. Filter for monitored, fetched, and all objects.
- New view panel. Improved marker editor with lightweight condition editor. Additional options to display date and time of refresh, and full object path. Can display same object with different draw styles and ranges simultaneously. May store current setup as Go4 picture.
- New condition editor: More compact layout, shares functionality with view panel marker editor.
- Improved parameter editor: May display user parameter structure without loading the user analysis library into the GUI. Suppresses display of unknown components.
- New dynamic list editor: More compact layout. Automatic resolving of event name and data member name when dragging and dropping from analysis event structure, in case of pointer entry. Dito for tree name and draw expression in case of tree entry.
- New dockwindow for analysis terminal. If analysis is started in external shell, functionality of analysis output window (macro execution, etc.) shrinks to dockwindow.
- Improved dialogs for analysis startup and connection.
- Decoupling of libraries from GUI. GUI does not require all analysis libraries anymore due to changes in command pattern and dependency rearrangements. Will speed up GUI startup time and may reduce memory consumption.
- Status monitor for remote MBS node. New dockwindow offering connection to the mbs status port. Frequently update of daq rates and status possible. Trending histograms in browser workspace. Full printout of mbs status and setup structures possible.
- Go4 analysis status bar improved. Animated Go4 logo shows true running state of analysis, independent of current event rate. Current event source of first active step displayed per name in text field.
- Remote control of Go4 analysis from regular ROOT session. Command interface to connect and control analysis process from CINT. Inspecting and retrieving Go4 objects with extended root TBrowser possible.
13.12 New features in Go4 v2.10 (June 05)
- Go4TaskHandler redesign: Decouple client and server tasks from master and slave role. This implies that analysis can run in the network both as server or client task (as in previous Go4 versions). Vice versa, gui can run either as client or as server (previous behavior). Additionally, TGo4AnalysisClient class now inherits TGo4Slave (previously TGo4ClientTask), and TGo4Display inherits TGo4Master (previously TGo4ServerTask). One analysis server can be connected by many Go4 GUIs (one controller/administrator GUI, and several observer GUIs).
- Go4TaskHandler redesign: Password for login of master client to slave server with accounts for administrator, controller, and observer roles. Additionally, some Go4 commands are forbidden if master is logged in with a low priority account (observer e.g. may not reconfigure analysis, but only request objects for display). Default passwords may be changed in MainUserAnalysis code (see chapter 5.3.2 page 39).
- Go4GUI prepared to run with analysis server: Command go4 -client will start the GUI master task in client mode. In this case, the Launch analysis dialogue requests for login account, password, node and connection port of the analysis server. Moreover, a client GUI may first launch a new analysis server in an xterm and connect to it afterwards (see chapter 5.3.2 page 39).
- Example of analysis server in package Go4Example2Step: MainUserAnalysis may be started from command line with option –server as third argument (first arguments like batch, see Fehler! Verweisquelle konnte nicht gefunden werden.,page Fehler! Textmarke nicht definiert.), thus starting the analysis as server. Processing starts immediately (no submit from GUI necessary). Command line parameters of this example will set additional boolean arguments (servermode, autorun) of TGo4AnalysisClient constructor appropriately (see chapter 5.3.2 page 39).
- ROOT macro execution with Go4 analysis server: A Go4 environment and analysis server can be started from any ROOT session in the background (.x go4Init.C). Go4 GUIs may connect to this server and request data from running analysis macros, or control macro via Start/Stop buttons. New methods TGo4Analysis::WaitForStart() to poll for the Go4 environment running state, and TGo4Analysis::Process() to invoke the Go4 analysis loop explicitely from ROOT macro (checks also for STOP). Example macros hsimple.C, hsimplego4.C and treedrawgo4.C. See chapter 6 page 76.
- Analysis: UserPreLoop() and UserPostLoop() are only executed once when analysis running state is changing. In previous versions, each press on Start, or Stop button, respectively, would execute the corresponding method another time. Bugfix: postloop was called twice if analysis client was terminated in running state.
- Bugfix: MbsAPI/f_evt.c (close of streamserver).
- Bugfix: Labels for conditions and markers were not drawn correctly in logscale anymore for ROOT v>4.03/02.
- Bugfix: Adjusted reallocation behaviour in TGo4Socket and TGo4Buffer to changed definition of TBuffer::kIsOwner flag for ROOT versions>4.03/02
- Fixed several small memory leaks.
13.13 New features in Go4 v2.9 (February 05)
- Keyboard shortcuts for many functions (see table chapter 11, page 90).
- Settings for Go4 GUI are now saved in the current directory by default in $PWD/.go4/go4localrc and $PWD/.go4/go4toolsrc, respectively. So different settings for the same login account are possible now. If the current directory does not contain a Go4 settings file on Go4 GUI startup, it will be created using the global account preferences at $HOME/.qt. Settings behavior can be changed using environment variable GO4SETTINGS. If this is set, the GUI preferences are used from directory $GO4SETTINGS. If GO4SETTINGS contains keyword ACCOUNT, the Go4 settings at $HOME/.qt are used (like in previous Go4 versions).
- New context sensitive menus (right mouse button popup) for all GUI browsers.
- ROOT object editor TGedEditor will show up in view panel side frame instead of top-level X-window. To implement this, the Go4 QtRoot interface has a new widget TQRootWindow which embeds a ROOT TGCompositeFrame into a QWidget.
- Superimposed drawn histograms, THStack objects and TMultiGraph will show a TLegend box in view panel. The legend box can be switched on or off by view panel menu.
- View panel marker editor: Added polygon shaped regions (TCutG).
- File browser: Added "Open remote file" functionality to read objects from TNetFile/XRootd (ROOT:), TWebFile (http:), and tape library (rfio:).
- Analysis browser: Objects may be protected against Clear() (histogram reset to 0), and against deletion in the analysis. Browser shows protection state in 3rd column as "C" and "D" symbols, respectively. Objects created from analysis code are always protected against deletion, objects created from GUI may be deleted from GUI again. Protection against clear may be changed using the browser's right mouse button menu. The protection state is persistent in the auto save file.
- Analysis: Histograms associated with Go4 picture objects will not appear anymore in the analysis Pictures folder, but only in the Histograms folder.
- Analysis macro: New analysis macro MainUserAnalysisMacro.C in directory Go4ExampleSimple. It needs a .rootmap file for automatically loading all necessary libraries. This file is created by the new files Makefile and Module.mk from the example. One can copy both files from the example, or modify existing files if they contain application specific changes. Look for map- expressions!
- New Method TGo4Analysis::Print() to print the current setup of the analysis and the steps.
- Multiple input file (metafile) for TGo4MbsFile may contain lines with CINT commands preceded by an "@" character. Commands, e.g. ROOT macro execution like ".x setup.C", are performed in between change of event source.
- Metafiles should have suffix .lml. Then they are recognized without @. The main programs in the examples have been modified not to add a .lmd to a .lml file name (update your main program accordingly!).
- TGo4FileSource: Partial IO functionality - name of the input event defines name of the tree branch to be read. Additionally, improved read performance for full event.
- New Example Go4ExampleMesh to show how to setup an analysis with non-subsequent analysis steps. May use partial input from tree branch.
- Reorganisation of Go4 make files and installation. Reduced number of Go4 libraries. Removed unnecessary ROOT dictionary information from libraries. Go4 may be installed without libASImage.so if this is not supported on the system.
- Implemented .rootmap mechanism to auto-load required Go4 libraries in macros.
- Bugfix: Preview panel options menu apply to all did not work for histogram statistics property.
- Bugfix: Double click in Go4 GUI browsers was not always working, because of conflict with drag and drop mode.
- Bugfix: When Submit was called without stopping the analysis before, references set in UserPreLoop() were not updated. Now UserPreLoop() is called also in this case. Additionally, UserPostLoop() is not called when analysis stops after initialization has failed.
- Bug fixes: A set of
use cases has been set up to test the GUI functionality. Several bugs have
been found and fixed performing these use cases. The test procedure has improved
the stability of the GUI. It will be extended and used for all future Go4
updates.
13.14 New features in Go4 v2.8 (September 04)
1. Marker editor in view panel allows for marking channels or windows. Labels and arrows can be created. All marker elements can be saved and restored.
2. New ROOT graphical editor can be called from view panel. The editor dynamically adjusts to the graphical object selected by LMB.
3. View panel window title: can optionally be set by user and may be kept constant. If a TGo4Picture is displayed, the picture name defines the view panel title.
4. Condition editor: the cursor mode has been removed because the functionality is now provided by the markers
5. Condition, markers and labels: Implemented correct ROOT streamer (bug fix), i.e. saving and loading these objects to and from ROOT files is possible with fully recovered functionality and graphical properties. Support of pad display in linear and log scale (bug fix). Additional controls in RMB menu of ROOT (set ranges, location, save default properties, reset). Default label setup stored with Go4 GUI settings.
6. Polygon condition: Implemented statistics functions for work histogram under the cut (integral, mean, rms, etc.). Enabled InsertPoint and RemovePoint functions in RMB menu (bug fix).
7. Fit GUI: Selection between sigma and FWHM (default) by Settings►Recalculate gauss width. Fit results may be printed to terminal or Go4 log file output.
8. 1D drawing: ROOT "L" (line) "C" (curve) "B" (bar chart) "P0" (poly-marker) line styles supported.
9. Histograms: re-binning, projections, and profiles supported (standard ROOT methods with RMB). Automatic “synchronize with memory” on pad click to get newly created histograms.
10. Histogram client: monitoring implemented (auto-update). Drag and drop support. Display error message when server connection is not available (bug fix). Store server specification in Go4 settings.
11. File store: Storing objects into a ROOT file a title is prompted. This title can be seen in the Go4 browser and the ROOT browser.
12.
UserObjects folder: With AddObject(...) histograms,
parameters and conditions can be put into folders of the
UserObjects folder. They can be located there by the standard Get methods, e.g. GetHistogram(). Editors work also
with objects in these folders. Note:
object names must be unique!
13.
Log window: Empty messages are now
suppressed (bug fix).
14.
QtRoot interface: bug fix concerning
initialization order of X11 system (ROOT init now before Qt init). Lead to
crash of the main GUI on newer Linux systems when using Qt versions > 3.1
(FEDORA2, SuSe9.1)
15.
Thread manager: bug fix: adjusted default
exception handling to work with newer libpthread.so that uses one process for
all threads (e.g. FEDORA2). This lead to a crash when Go4 threads were canceled
(shutdown of the go4 GUI).
16.
Analysis Framework: bug fix: analysis without
analysis step (UserEventFunc() only) again
possible.
17.
Client startup script: full PATH and LD_LIBRARY_PATH of the Go4 GUI environment
is passed to the analysis process.
13.15 New features in Go4 v2.7 (June 04)
1. Keyboard shortcuts (Alt-1 to Alt-5) to select browser tabs (File, Monitor, Remote, Memory, Histogram client). Items are selectable with arrow keys (left-right to unfold and shrink subfolders). Return key acts as double click.
2. MBS event classes improvements: Method TGo4MbsSubEvent::IsFilled() checks if the sub-event was filled in the previous event built. Iterator TGo4MbsEvent::NextSubEvent() by default delivers newly filled sub-events only, suppressing existing sub-events in list of non used ids. Sub-event data field re-uses the memory allocated by libgsievent instead of copying it to own buffers. New method TGo4MbsEvent::SetPrintEvent() to set verbose mode for the next n events. Format changes in TGo4MbsEvent::PrintEvent().
3. Performance improvements of analysis framework in step manager, dynamic list and MBS event classes.
4. New EventInfo toolwindow to control printout of an event sample in remote or local terminal. Optionally the user implemented PrintEvent() method, or the ROOT TTree::Show() output may be used. May control the arguments of TGo4MbsEvent::SetPrintEvent(). Supports drag and drop for event names from remote browser.
5. Display total memory consumption of histograms and conditions at the end of PrintHistograms() and PrintConditions() execution, respectively.
6. TCanvas support in file browser improved: Histograms saved inside a TCanvas in a ROOT file will appear in memory browser whenever this canvas is displayed
7. Analysis Terminal window: Limitation of text history buffer to 100 Kb by default, may be changed in settings menu. Disabled text wrapping in output for scrollbars.
8. Scale values dialog window extended by zmin and zmax fields. Allows setting minimum and maximum thresholds for channel contents of 2d histograms when auto scale is off.
9. Conservation of TLateX textfields when changing draw style or histogram statistics boxes visibility
10. File browser open file dialog allows multiple file selection
11. Analysis configuration window: remember path to previous selected file in event source, auto-save, and preferences dialogs. Some layout cleanups.
12. Superimpose of histograms with same name from different files possible if overwrite mode is deselected in memory browser. Histograms will be copied to memory browser with cycle numbers added to names.
13. Bugfix: Superimpose THStack does not crash anymore when deleting histograms
14. Bugfix: Crash after closing and re-opening view panel for same histogram with different sub-pad divisions
15. Bugfix: Analysis did stop when an analysis step without event processor is disabled
16. Bugfix: histogram bound to condition was not fetched from analysis when double clicking on remote condition icon
17. Bugfix: Double click on histogram in divided view panel did pop up this histogram magnified in a new view panel, but did not initialize view panel colours and crosshair settings correctly.
13.16 New features in Go4 v2.6 (May 04)
1. New Go4 Hotstart: The current setup of the GUI (analysis name and settings, view panel geometry, objects in memory and monitor browser, displayed objects in pads) may be saved to a hot start script file (postfix ".hotstart") from the Settings►Generate hotstart menu. The script name may be passed as argument on next Go4 GUI startup (e.g. "go4 mysetup"), which will launch the analysis and restore the settings (e.g. from file "mysetup.hotstart").
2. New TGo4ExportManager class transforms and saves ROOT objects into other formats. Currently supported: plain ASCII (*.hdat, *.gdat) and Radware/gf3 (*.spe). An export filter is available in the GUI memory browser to save selected objects.
3. Redesign of Go4 Auto-save mechanism. Subfolders are mapped as TDirectory in TFile now, thus improving performance for large number of objects. Auto-save file is closed after each write, avoiding invalid file states in case of analysis crash. Dynamic list entries are saved as independent objects.
4. Example macro Go4Example2Step/convertfile.C converts all histograms and graphs from ROOT file into ASCII files, conserving the subfolder hierarchy.
5. New TGo4StepFactory class can be used as standard step factory to simplify the setup of analysis steps for small analyses. New example package Go4Example1Step shows the usage.
6. The TGo4Analysis class can now be used as standard analysis class. New example package Go4ExampleSimple shows the usage.
7. New view panel has size of previously active view panel. Default view panel starting size is stored in settings and recovered on next Go4 startup.
8. View panel: Switch on/off histogram title display in options menu.
9. View panel: Switch on/off crosshair for each pad in options menu. Default crosshair mode can be selected in main window settings menu and is saved and restored by Go4 settings. Crosshair mode button in condition editor has been removed.
10. View panel: Default background color can be selected in main window settings menu and is saved/restored by Go4 settings.
11. TCanvas objects in analysis task may be send and displayed on GUI. Works both for memory and monitoring list.
12. Support of TMultiGraph objects in analysis and GUI (display, memory and monitoring list update).
13. New draw option TASImage for 2 dim histograms in Go4GUI. May improve rendering speed for large maps when updating and resizing the canvas. Offers own palette editor in right mouse button popup menu.
14. Parameter editor: Added column to display the source code comments for each parameter class member as description.
15. Condition editor: General editor has button to create a new condition. New condition is defined in a dialog window and is put into general editor. May be sent to analysis for registration, or saved into a file then. All types of new conditions (window, polygon, array of these with variable size) are supported.
16. Object editors (condition, parameter, dynamic list) may save and load objects from/to ROOT files.
17. Status messages of object editors appear in bottom status line of Go4 main window.
18. Support of dynamic list entries in file browse: Editor opens on double click.
19. Histogram and Condition info windows: Object size now takes into account real data size on heap.
20. New analysis toolbar button for "re-submit and start" shortcut. Useful when file shall be re-read from the beginning after changing something in the setup.
21. Auto-save may be disabled completely from analysis configuration GUI.
22. New mode for TGo4MbsFile (*.lmd) wildcard/metafile input: Auto-save file may change its name whenever input file is changed. Name is automatically derived from input filename. Old behavior (one auto-save summing up all inputs) is still possible. This can be switched with method TGo4Analysis::SetAutoSaveFileChange(bool ).
23. End of .lmd file input gives informational message instead of error message.
24. Bug fix: avoid log-file crash when Go4 is started in directory without write access.
25. Bug fix in Go4 Mainwindow exit dialog. Exit via window "x" icon works properly now, too.
26. Some adjustments to work with ROOT versions > 4.00 in Go4Fit and qtroot packages
13.17 New features in Go4 v2.5 (December 03)
1. Histograms may be bound to conditions by method TGo4Conditions::SetHistogram(). The bound histogram will be fetched automatically in GUI whenever condition is edited.
2. TGo4Picture can contain conditions together with histogram objects.
3. General condition editor in addition to the condition specific editors. Supports drag and drop of condition icons and conditions linked to TGo4Pictures.
4. Warning label for unsaved changes in condition editor, and in dynamic list editor.
5. Condition editor cursor tab can make copies of the current cursor marker. For printouts with multiple markers.
6. Analysis log window in GUI displays date and time of last refresh.
7. New histogram status window, and condition status window in GUI.
8. Redesign of GUI object management: Added drag and drop support of TGraph, TGo4Picture from all browsers. Bug fix and improvements in histogram superimpose mode.
9. Monitoring list supports TGraph, TGo4Picture, and THStack.
10. Logfile mechanism for GUI actions. Log output configurable in Settings menu. Logging output on demand from condition editor, histogram and condition status windows.
11. View pane can turn on or off histogram statistics box.
12. View panel supports fix/auto scale modes for TH1, THStack, and TGraph objects.
13. View panel resize speed improved (redraw only at the end of resize action). View panel does not start in full screen mode anymore.
14. Analysis terminal: New buttons for clearing the terminal, PrintHistograms, PrintConditions. Command line has shortcut “@” for “TGo4Analysis::Instance()->”. “KillAnalysis” button buffered with confirmation dialog window.
15. “Quit Go4” button buffered with confirmation dialog window.
16. Dynamic list editor can change the global dynamic list interval for analysis.
17. Reorganization of GUI icons.
18. Performance improvements in TTimers of Go4 kernel: Removed Turn On/Off statements.
19. New method TGo4Analysis::NextMatchingObject() for search in analysis objects with wildcard expression.
20. Analysis: PrintHistograms(), PrintConditions() supports wildcard expressions for output list selection.
21. New methods: TGo4Analysis::StoreParameter, StoreCondition, StoreFitter, StoreFolder to write these objects into event store of an analysis step. Event number will be appended to object keys for parameter logging.
22. Consistency checks of analysis steps can be disabled by new method TGo4Analysis::SetStepChecking(bool). For setting up of non serial type analysis steps with own user management.
23. TGo4MbsEvent::PrintEvent() extended to display headers and also data field contents of sub-events.
24. New methods: TGo4MbsEvent::GetMbsBufferHeader(), TGo4MbsSource::GetBufferHeader() to access the buffer headers of list-mode files. Implemented example in Go4Example2Step.
25. Go4 GSI histogram server also exports TGraph objects as histograms (if possible).
26. Implementation of TGo4Condition::Paint() to display Go4 conditions in regular ROOT environment. Conditions may be drawn on TPad which already contains a histogram. New classes for condition painters and condition views.
27. Reorganization of the distribution make files.
13.18 New features in Go4 v2.4 (August 03)
1. New Package Go4Log to handle all messages and log file. This replaces the old package Go4Trace. Static method TGo4Log::Message(char*, ...) can be called everywhere to display text on terminal and optionally write to log file. Modified Go4 message prompt.
2. Header information of MBS list-mode data files accessible by new methods s_filhe* TGo4MbsSource::GetInfoHeader() and s_filhe* TGo4MbsEvent::GetMbsSourceHeader().
3. Event source class TGo4MbsRandom to deliver random spectra into MBS events without connection to MBS node or reading list-mode file. Matches event structure of standard example Go4Example2Step.
4. TGo4Picture objects can be used in the monitoring list.
5. Changes in Analysis configuration window: Number of events, start/stop/skip events may be specified; tag file name and optional socket timeout. File browser for event source files. Auto-save interval now refers to time (seconds) instead number of events. Modified layout.
6. Dynamic list editor with button to PrintAll dynamic list entries on analysis terminal.
7. Improved postscript print dialog in View-panel menu.
8. Histogram client API supports conversion into Radware format.
9. Go4 histogram server supports float histograms.
10. Execution of ROOT interpreter commands / macros in the analysis task possible by command line in analysis terminal window.
11. Re-design of condition editor:
a. Display all conditions of array in different colors or hide them optionally. Visibility in editor is property of TGo4Condition and stored in auto-save file.
b. Working view-panel pad and reference histogram of condition may be changed at any time.
c. Clear counters button applies clearing to analysis condition immediately and refreshes editor from analysis.
d. Statistics inside window condition limits (integral, maximum, mean, rms, etc) are calculated; these values are displayed in editor and may be drawn in labels on working pad. Methods to calculate statistical quantities belong to TGo4WindowCondition class and may be used in analysis, too.
e. Cursor panel with crosshair mode and optional marker to pick values from displayed histogram. Cursor may be set by mouse click, by moving the graphical marker object, or by defining cursor position in the text fields. Cursor values may be drawn in label on working pad
f. Extension of polygon condition /TCutG is calculated and shown like the borders of the window condition.
g. Improved creation of new TCutG functionality. Assignment to current polygon condition may be cancelled. Handles pads with multiple TCutGs.
12. Added class TXXCalibPar to Go4Example2Step. Shows a procedure how to calibrate spectra using the Go4 fitter in connection with the parameter mechanism and an ASCII file “database” of line energies.
13. Make full screen default for new view panels.
14. When updating objects in Memory folder, a redraw is done automatically.
15. When monitor updates a View-panel, the pads are updated without blocking the GUI (not yet for picture)
16. Button besides zoom buttons to enter display limits by values
17. Drag pictures from Analysis pad to View-panel (only empty view panel, or is inserted in pad)
18. Some buttons on the browser pads have been rearranged to be consistent. On Memory browser pad the icons for "update local objects" and "synchronize with directory" have been exchanged to be consistent with Analysis pad.
13.19 New features in Go4 v2.3 (May 03)
1. TGraph objects can be registered and displayed correctly. Reset of TGraph (clear all points) by “eraser” button from GUI possible.
2. Reset/clear complete folders by selecting them in remote browser and
“eraser” button. New method ClearObjects(“Histograms”) to reset all objects of
named folder, e.g. all histograms at once.
3. “Print” button to printout histogram and condition lists with
statistics in analysis terminal. These buttons are located in the dynamic list
editor.
4. Parameter classes may contain TGo4Fitter* references or arrays of these. Fit GUI can be used to edit fitter from within parameter editor. Framework provides new class TGo4FitterEnvelope as example parameter. Example put into TXXXAnalysis.
5. User defined event source is possible. New class TGo4UserSourceParameter to be checked in analysis step factory for any kind of input. Example package Go4ExampleUserSource shows usage.
6. New class TGo4Picture to define layout of canvas with histograms. Pictures are registered in Go4 Pictures folder and stored in auto-save file like histograms; they can be displayed in any view-panel. Example added in TXXXAnalysis.
7. Possibility to register complete TCanvas objects in Go4 Canvases folder to be saved within auto-save file. Switch TGo4Analysis into ROOT batch mode to suppress drawing actions in analysis client while canvas is set up.
8. Go4 GUI can display and compare objects from different files in the same view panel now.
13.20 New features in Go4 v2.2 (April 03)
1. Possibility to select rsh or ssh and analysis output in Xterm or GUI window.
2. Wildcard in input lmd file names.
3. Input file name beginning with @ is interpreted as text file containing lmd file names.
4. An auto-save file can be written on demand (button in configuration menu).
5. Parameter editor. User parameter objects (subclasses of TGo4Parameter) registered in the analysis can be edited in the GUI by double click in the browser. Currently supported members are the primary data types and arrays of these.
6. New environment variable GO4USERLIBRARY can be set to a colon separated list of ROOT user libraries which are loaded automatically in the GUI. This is needed for editing parameter objects.
7. Dynamic lists. A dynamic list editor can be used to create/specify dynamic entries. A dynamic entry consists of a histogram (can be created new) and a member of an event object which shall be histogrammed. Optionally a condition can be added. The condition also can be created new. The event structure is expanded in the browser. Drag&drop is provided to select members.
8. The condition editor has been improved. Arrays are now handled properly. TCutGs for polygon conditions can be created new.
9. TGraph objects are supported like histograms.
10. In the Go4 view panel, the ROOT "event status" (cursor position) can be displayed.
11. The new fit GUI is available. It includes three different peak finders, a simple fitter, a wizard, and full access to all fitter components. Fitters can be stored/retrieved to/from files or memory.
12. User Makefile: the user executable need to be linked against the make file variable $(GO4LIBS) only, as defined in the Makefile.config of the framework (see Makefile of example Go4Example2Step).