Multi wire proportional chamber; x, y position detector
This page was last modified by Dr. Helmut Weick, 19th Feb 2020, contact h.weick(at)gsi.de, Imprint (Impressum), Privacy Policy (Datenschutzerklärung)
The MWPCs are used in the FRS to measure x and y position in the focal planes. Standard are:
| focal plane | name(s) | nomenclature |
|---|---|---|
| S1 | MW11 | TS3DG2T |
| S2 | MW21, MW22 | TS3DG5T, TS3DG7T |
| S3 | MW31 | TS4DG3T |
| S4 | MW41, MW42 | HFSDG2T, HFSDG3T |
| S5 | MW51 | TS5DG1T |
| S7 | MW71 | TS7DG1T |
| S8 | MW81, MW82 | TH4DG4T, TH4DGAT |
MW11-MW31 and MW51-MW82 are mounted in pockets which can be
moved by air pressure into the vacuum tube. The pockets have 100μm
Ti or 150μm Fe windows on both sides.
MW41 and MW42 could be mounted on air. In this
case the gas volume is separated by 25μm kapton foils.
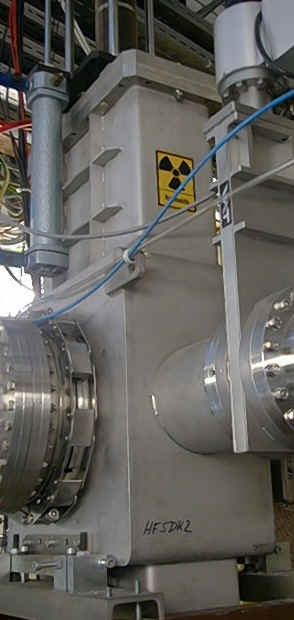
Vacuum chamber of MWPC in the FRS beamline with radioactive source
mounted at the out position (left upper corner looking downstream
with the beam), where you can see the sticker.
The MWPC has three grids. Anode (A), (G) and (T). Electrons are emitted from the gap around or the cathode material. Towards the thin anode wires the electron current is amplified by secondary electrons in an avalanche process. The gap is filled with a CO2 / Argon mixture.
More details about the construction of the MWPC interior in this report by Michael Träger from the GSI Detector Lab (in German).
In most cases the pockets have 100μm Ti windows on both sides, some have steel windows. The details for each individual MWPC are written in the data sheets.
The typical position resolution is about 0.5 mm and the detectors cover an area of 200mm x 200mm.
| Layer | Material | d [mg/cm2] | d [mg/cm2] of Al | rms d [mg/cm2] of Al |
|---|---|---|---|---|
| vacuum window (2 x 100 μm) | Ti | 90.2 | 82.9 | ~ 0 |
| vacuum window (2 x 150 μm) | Fe | 236 | 213 | ~ 0 |
| air window (2 x 25 μm) | kapton | 5.1 | 5.8 | ~ 0 |
| counter gas (110 mm) | Ar / CO2 | 17.1 | 16.9 | ~ 0 |
| Pregap (4 planes) | PolyNi | --- | 12.4 | 7 |
| sum with Ti windows | --- | 112 | 7 | |
| sum with Fe windows | --- | 242 | 7 | |
| sum with kapton windows | --- | 35 | 7 |
Matter distribution of one MWPC. The values are given for the respective material as well as for an equivalent layer of aluminum. They correspond to the total number of layers or wire planes in one detector. The probability for hitting a cathode wire is 10% for one detector. The anode plane is ignored because hits on the anode wires are rather improbable (see next table). The pregap planes consist of a nickel-plated polyester mesh. The fibers have a thickness of 36 μm with a spacing to the next fiber of 50 μm, leading to a strong inhomogenity (rms d) of this layer.
| Plane (no. of planes per counter) | Material | Distance [μm] | Diameter [μm] | Maximal thickness [mg/cm2] | Equivalent max. Al thickness [mg/cm2] |
|---|---|---|---|---|---|
| Pregap (4) | PolyNi | 86 | 36 | --- | 9.4 |
| Cathode (2) | tungsten (W) | 1000 | 50 | 96.3 | 67.4 |
| Anode (1) | tungsten (W) | 2000 | 20 | 38.5 | 26.9 |
Geometry and material thickness of the wire planes. Given are the
distances between the wires, the diameter and the material
thickness at the thickest point for the wire materials as well as
the thickness of an equivalent layer of aluminum. The values
correspond to one wire plane. The anode wires are rotated by 45deg
versus the cathode wires.
For most applications with heavy ions only the anode voltage is used. For lighter ions (Z<6, Carbon) a pregap has to be used to amplify the number of electrons in the avalanche.
When using the pregap the most important point in setting the detector high voltage is to make sure the pregap voltage is not too high, which leads to sparks and will eventually destroy the pregap. To prevent this, the voltage UT always has to be applied before the voltage UG is activated. As an additional precautionary measure, the C.A.E.N. high voltage system must be programmed such that the UG voltage is switched off immediately if an overcurrent occurs (parameter TRIP = 0) while the voltage UT should never trip at all (TRIP = 9999, see the C.A.E.N. manual in the pink FRS folder). If the voltage UA is too high, sparking can only occur when a strong beam is impinging on the detector. Even though this is not quite as harmful as a sparking pregap, the TRIP parameter for the UA channels should also be set to 0.
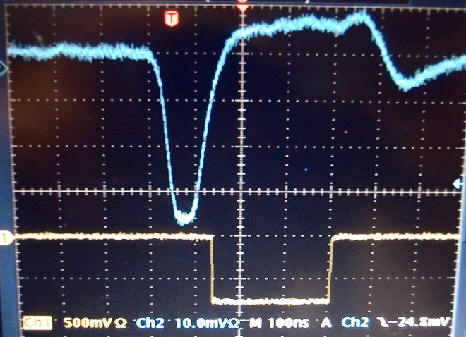
When the pregap is used, even minimum-ionizing particles (e.g. anti-protons at 1 GeV/u) yield appropriate signal heights. For medium to very heavy ions, however, a rather strong signal is induced at the anode wire plane which leads to the formation of two pulses: A smaller primary one from the anode plane and a larger second one from the pregap avalanche, which is delayed by a drift time of about 550 ns. For nuclei above ~ Ar (Z=18), the anode voltage can not be lowered far enough to suppress the first signal entirely. In that case, the pregap should be switched off and the anode signal alone be used.
In setting the detector voltages, we recommend to proceed as follows:
| Beam | UG [kV] | UT [kV] | UA [kV] |
|---|---|---|---|
| β-source (500 keV) | 0 | 0 | 2.5 |
| β-source (500 keV) | -8.3 | -1.1 | 2.0 |
| Ar at 1000 MeV/u | 0 | 0 | 2.2 |
| Xe at 800 MeV/u | 0 | 0 | 1.9 |
| Au at 600 MeV/u | 0 | 0 | 1.8 |
| Pb at 800 MeV/u | 0 | 0 | 1.8 |
| Ne at 150 MeV/u | -9.0 | -2.1 | 2.5 |
| Cr at 200 MeV/u | -8.1 | -1.1 | 2.0 |
| Kr at 200 MeV/u | 0 | 0 | 2.2 |
| Ar at 1000 MeV/u | -9.0 | -2.1 | 2.6 |
| antiprotons 1000 MeV/u | -9.0 | -2.1 | 2.7 |
These values can only serve as guidelines. The voltage necessary can vary significantly between single detectors. As an example values for 200 MeV/u 238U from December 2003. Only the anode HV was used.
| name(s) | UA [kV] |
|---|---|
|
MW11 |
1.85 |
|
MW21, MW22 |
2.40, 1.65 |
|
MW31 |
1.73 |
|
MW41, MW42 |
2.40, 1.75 |
The Preamplifiers are located directly at the flange with connectors to the MWPCs. the pulser entrance goes directly to the center of the delay lines.
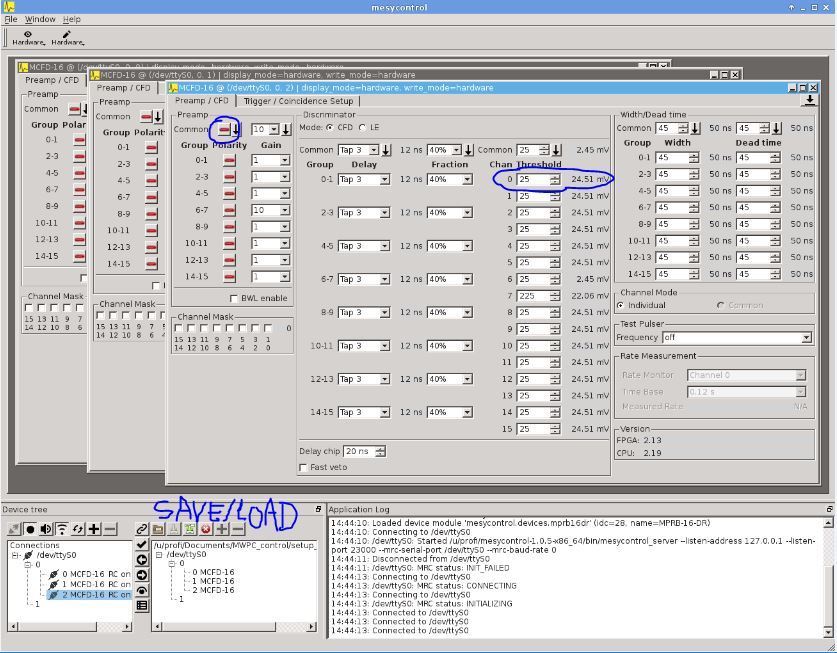
Block diagram of MWPC electronics. The anode or cathode signals go onto a MESYTEC constant fraction discriminator. Entrance voltage should be >100 mV and < 5V. Shorter delays are used for the anodes so they can be used as a trigger. The NIM signals go onto a VME TDC (CEAN V775) and into the RIO DAQ.
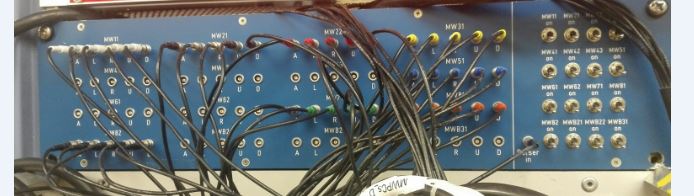
The panel in FRS electronics room with incoming signals:
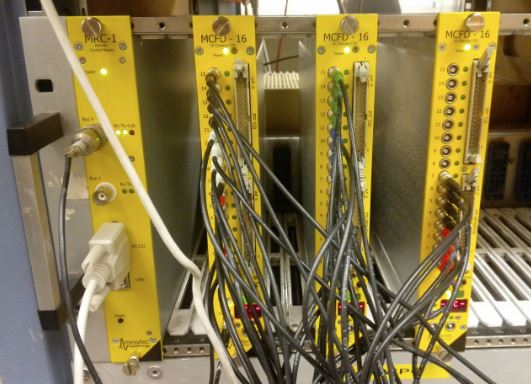
The 3 Mesytec CFD modules:
Perhaps there is still a hardware switch for selection of MWPC on trigger box 1 or 2.
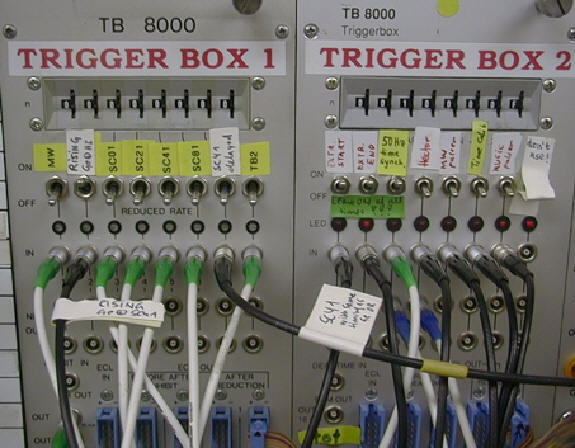
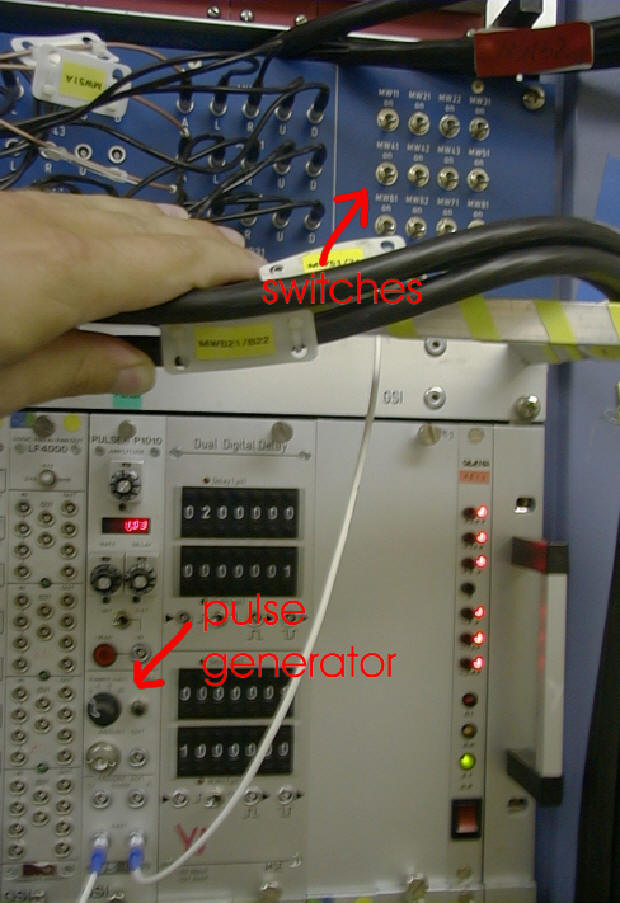
A pulser signal can be fed to the middle of the delay line. From the pulse generator (see picture) the pulse can be distributed to all MWPCs with the many switches. Only cathodes can be tested. To get a trigger signal use the switch "MW pulser" from trigger box 2 and select TB2 in trigger box 1.
The readout is done via a delay line and not via the single wires. Each wire corresponds to a different delay time which is converted with a TDC. The TDC channels are named XL, XR, YO, YU (x left, x right, y up, y down). For a good event the sum XL+XR or YO+YU should be a constant. Under this condition the positions are determined from the difference of the delay. They are calculated as follows:
x [mm] = x_factor * (XL - XR) + x_offset
y [mm] = y_factor * (YO - YU) + y_offset
The factor depends on the delay lines and on the TDC used. Currently it is 0.0732 mm/channel (4.0ns/2mm delays, 1200ns range for 4096 TDC channels). The offsets are close to zero. The factor and offset are set in the online analysis program (setup.C for GO4). There also the cut window on the sum peak has to be defined to clean the spectrum. In the focal planes with two MWPCs the angle can be measured as well, tan(α) = (x2 - x1) / distance.
Offset calibration can be achieved by one of two methods: The easier one is to use the pulser signal - which is fed to the middle of the delay line, to obtain the electronic centre of the detector. The source of error here is that the detectors are only aligned with an accuracy of about ±1 mm relative to the beam line.
Another method is to align the primary beam with the current grids. Then the beam current is decreased to several hundred particles per spill and observed with the MWPCs. The offset is then determined by taking the mean value of the resulting spectrum. In case the slits are close to the MWPCs one can use the step motor position for calibration.
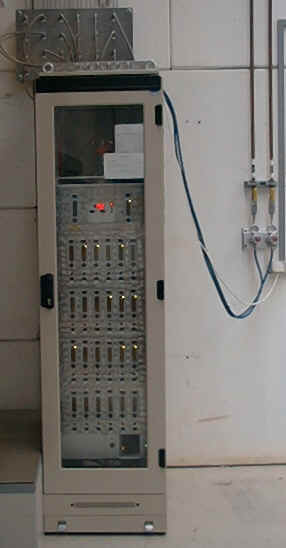
The detectors operate with a mixture of argon, CO2 and a little alcohol at atmospheric pressure. The gas flow can be controlled independently for the four focal planes S1 through S4 and is set to roughly 5 l/hour. Before the detectors can be used, gas flow has to be provided for at least 12 hours. The GSI detector laboratory (Dr. C.J. Schmidt, Mr. Michael Träger (Tel. 2639)) takes care of the gas supply unit and has to be informed in advance. The gas flow is controlled, mixed and monitored from the cupboard in front of the cave entrance, see picture.
 l
l
Report on Konstruktion of MWPC by Michael Träger from GSI Detector Lab (pdf, in German)
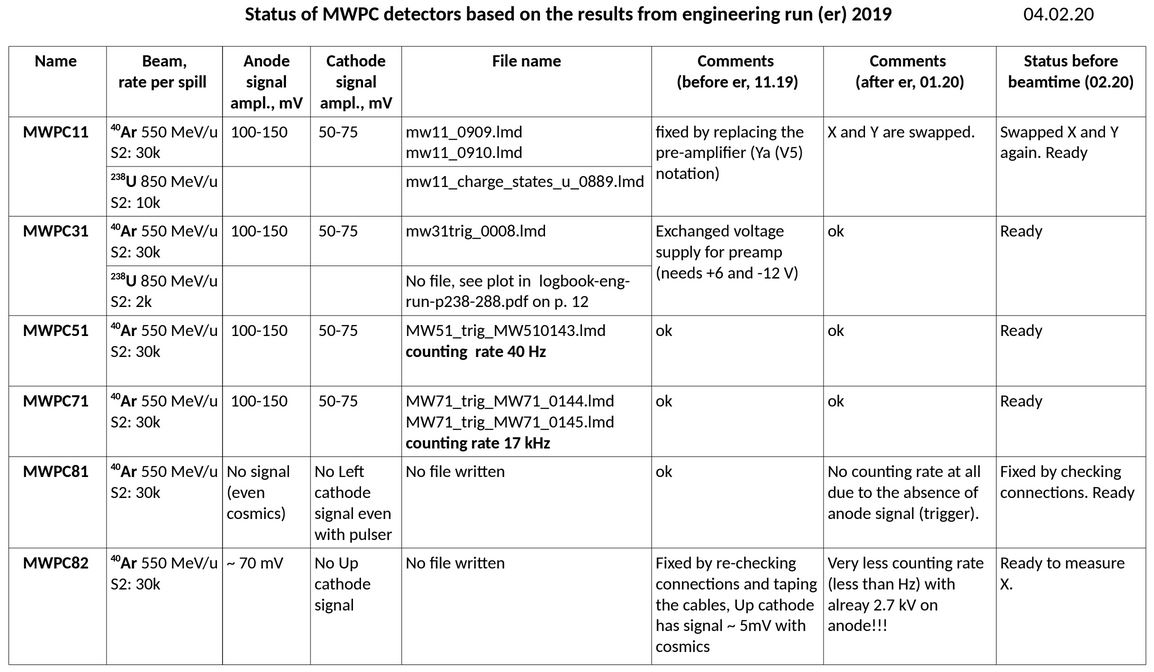
Test results from end of 2019 with Ar beam by Daria Kostyleva.
table (original on
Google drive).