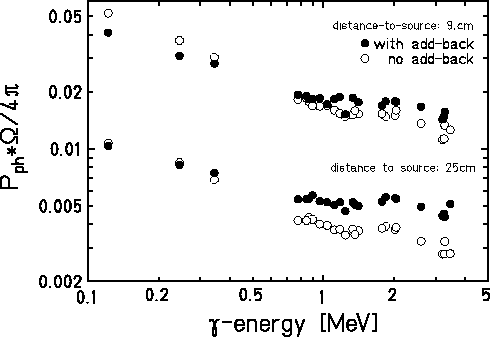
Figure 4.1: Absolute efficiency of Super Clover detector measured in
add-back mode (full circle) and by summing the values of the four individual
Ge-crystals (open circle) at a distance of 9cm and 25cm to the source.
In the present section we discuss the results of the absolute efficiency
measurements with the Super Clover detector. The ![]() -ray sources
-ray sources
![]() ,
, ![]() ,
, ![]() and
and ![]() were placed central to the
detector face at distances of 9 cm and 25 cm from the front of the crystal.
For
were placed central to the
detector face at distances of 9 cm and 25 cm from the front of the crystal.
For ![]() ,
, ![]() and
and ![]() the present activities were 133 kBq,
149 kBq and 287 kBq, respectively. The original activities were given with
an accuracy of
the present activities were 133 kBq,
149 kBq and 287 kBq, respectively. The original activities were given with
an accuracy of ![]() by the manufacturers.
The total count rate for each Germanium crystal was 5000 counts per second
at a distance of 9 cm and 1000 counts per second at a distance of 25 cm.
Each measurement was made after 3000 to 10000 counts had been incremented
into the peak channel of the
by the manufacturers.
The total count rate for each Germanium crystal was 5000 counts per second
at a distance of 9 cm and 1000 counts per second at a distance of 25 cm.
Each measurement was made after 3000 to 10000 counts had been incremented
into the peak channel of the ![]() -ray of interest. The results of the
absolute efficiency measurements are shown in figure4.1.
-ray of interest. The results of the
absolute efficiency measurements are shown in figure4.1.
At a distance of 9 cm the count rate is approximately a factor of 4.3 larger
than at a distance of 25 cm which is only half of the ratio ![]() .
The reason for this deviation is the inaccurate determined solid angle and
the outer border of the crystals which can be illuminated by the
.
The reason for this deviation is the inaccurate determined solid angle and
the outer border of the crystals which can be illuminated by the ![]() -rays
at a distance of 9 cm but the Germanium material is not thick enough to detect
the full energy of the
-rays
at a distance of 9 cm but the Germanium material is not thick enough to detect
the full energy of the ![]() -ray.
-ray.
The area of the front face of the Super Clover detector is 112 ![]() (area = 135
(area = 135 ![]() at 2.7 cm backwards of the front face).
If one approximates the detector surface by a cycle, the corresponding
radius is r=6.1 cm. The correct formula for the solid angle at a distance
R to the
at 2.7 cm backwards of the front face).
If one approximates the detector surface by a cycle, the corresponding
radius is r=6.1 cm. The correct formula for the solid angle at a distance
R to the ![]() -ray source is given by
-ray source is given by
![]()
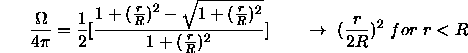
where ![]() is the opening angle of the detector.
is the opening angle of the detector.
In the framework of our approximation the ratio of the count rates should
be 6.0 measured at R=9 cm and R=25 cm. In order to get complete agreement
with the measured value of 4.3, the opening angle of the Super Clover
detector has to be reduced by approximately ![]() when the
when the ![]() -ray
source is only 9 cm away.
-ray
source is only 9 cm away.
The total ![]() -ray efficiency of the Super Clover detector depends not only
on the individual efficiency of the 4 individual Germanium detectors but also
on the capability to operate the detector in the add-back mode.
In this mode the energies deposited in several detectors because of Compton
scattering can be added up and the full energy of a
-ray efficiency of the Super Clover detector depends not only
on the individual efficiency of the 4 individual Germanium detectors but also
on the capability to operate the detector in the add-back mode.
In this mode the energies deposited in several detectors because of Compton
scattering can be added up and the full energy of a ![]() -ray can be
determined in many cases. The results of the absolute efficiency
measurements are shown in figure4.1 for the add-back mode
and for the summed efficiency of the four individual crystals.
The importance of the add-back technique is obvious. For very low
-ray can be
determined in many cases. The results of the absolute efficiency
measurements are shown in figure4.1 for the add-back mode
and for the summed efficiency of the four individual crystals.
The importance of the add-back technique is obvious. For very low ![]() -ray
energies (
-ray
energies ( ![]() ) the photo effect in one Germanium detector is the most
likely process for the interaction between the incident
) the photo effect in one Germanium detector is the most
likely process for the interaction between the incident ![]() -ray and the
Super Clover detector. The number of multiple events increases very fast with
increasing
-ray and the
Super Clover detector. The number of multiple events increases very fast with
increasing ![]() -energy.
-energy.
The add-back factor is defined as the total number of photo events (single
and multiple fold photo events) divided by the number of single photo events
for a given energy. It increases very fast from 1.0 for low energies
( ![]() 250 keV) to 1.5 for 1500 keV. An add-back factor of 1.0 means that
no multiple events occur, whereas a factor of 1.5 means that one-third of
all events are multiple events. The experimental results at both distances
are displayed in figure4.2.
250 keV) to 1.5 for 1500 keV. An add-back factor of 1.0 means that
no multiple events occur, whereas a factor of 1.5 means that one-third of
all events are multiple events. The experimental results at both distances
are displayed in figure4.2.
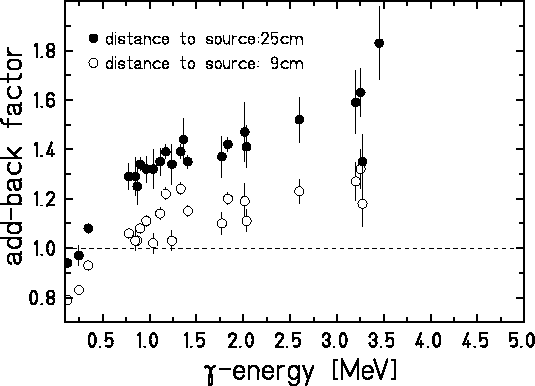
Figure 4.2: Add-back factor (see text) as a function of the ![]() -ray
energy for different sources measured at 9 cm (open circle) and 25 cm (full circle).
-ray
energy for different sources measured at 9 cm (open circle) and 25 cm (full circle).
The ![]() -ray spectra measured with the Super Clover detector at a distance
of 25 cm to a
-ray spectra measured with the Super Clover detector at a distance
of 25 cm to a ![]() ,
, ![]() and
and ![]() -source are shown in
figure4.3, figure4.4 and figure4.5,
respectively. The peak displacement of the add-back contribution
(vertically hetched area) is due to a cross-talk between the different
Ge-crystals.
-source are shown in
figure4.3, figure4.4 and figure4.5,
respectively. The peak displacement of the add-back contribution
(vertically hetched area) is due to a cross-talk between the different
Ge-crystals.
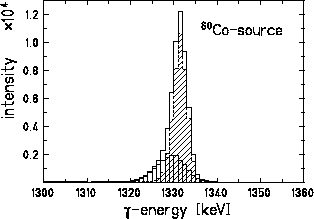
Figure 4.3: Contributions to the total ![]() -ray spectrum measured
for a
-ray spectrum measured
for a ![]() source at 25 cm with the Super Clover detector: photopeak
detection by the 4 inner contacts (
source at 25 cm with the Super Clover detector: photopeak
detection by the 4 inner contacts ( ![]() hetched area) and add-back
contribution (vertically hetched area).
hetched area) and add-back
contribution (vertically hetched area).
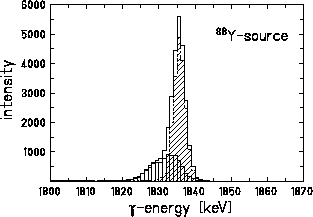
Figure 4.4: Contributions to the total ![]() -ray spectrum measured
for a
-ray spectrum measured
for a ![]() source at 25 cm with the Super Clover detector: photopeak
detection by the 4 inner contacts (
source at 25 cm with the Super Clover detector: photopeak
detection by the 4 inner contacts ( ![]() hetched area) and add-back
contribution (vertically hetched area).
hetched area) and add-back
contribution (vertically hetched area).
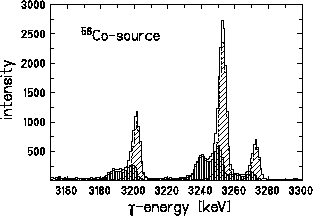
Figure 4.5: Contributions to the total ![]() -ray spectrum measured
for a
-ray spectrum measured
for a ![]() source at 25 cm with the Super Clover detector: photopeak
detection by the 4 inner contacts (
source at 25 cm with the Super Clover detector: photopeak
detection by the 4 inner contacts ( ![]() hetched area) and add-back
contribution (vertically hetched area).
hetched area) and add-back
contribution (vertically hetched area).