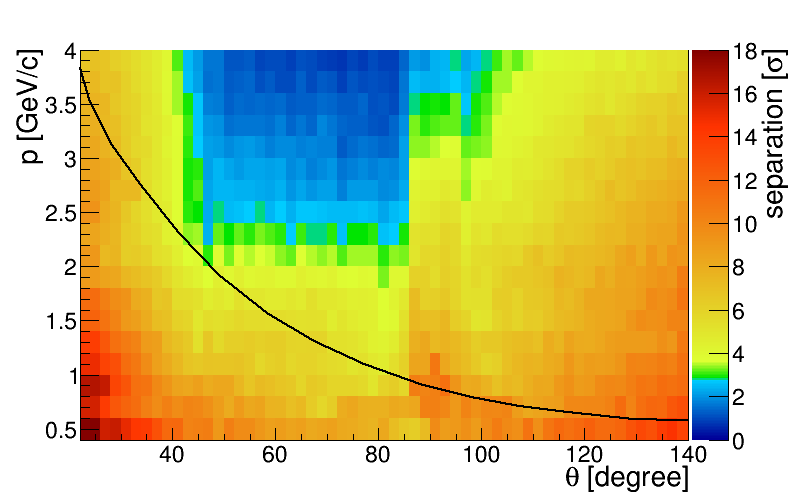
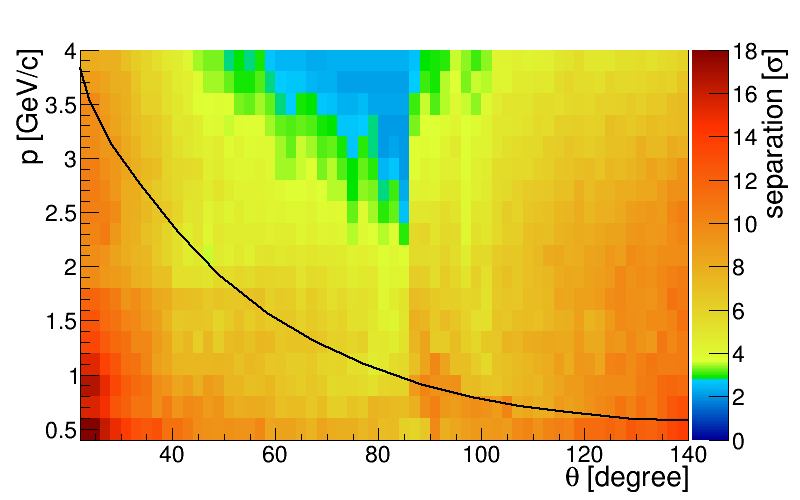
Likelihood separation map using time imaging reconstruction. Pions vs. Kaons. 3 mrad track smearing. The configurations with plate without lens (top) and with 3 component cylindrical lens (bottom) where used. 100 ps time resolution of MCP PMTs is assumed. The black line outlines the final phase space distribution of kaons from different channels.