Reconstruction performance of the beam data with calibration laser.
- CERN 18
- bar with 3-layer spherical lens attached to the edge of the prism
- p/pi @ 7 GeV/c; 25 degree polar angle
- geometrical and TI reconstruction
- delta t selection with s = 0.5 ns
- with beam direction correction
- with per-PMT Cherenkov angle correction
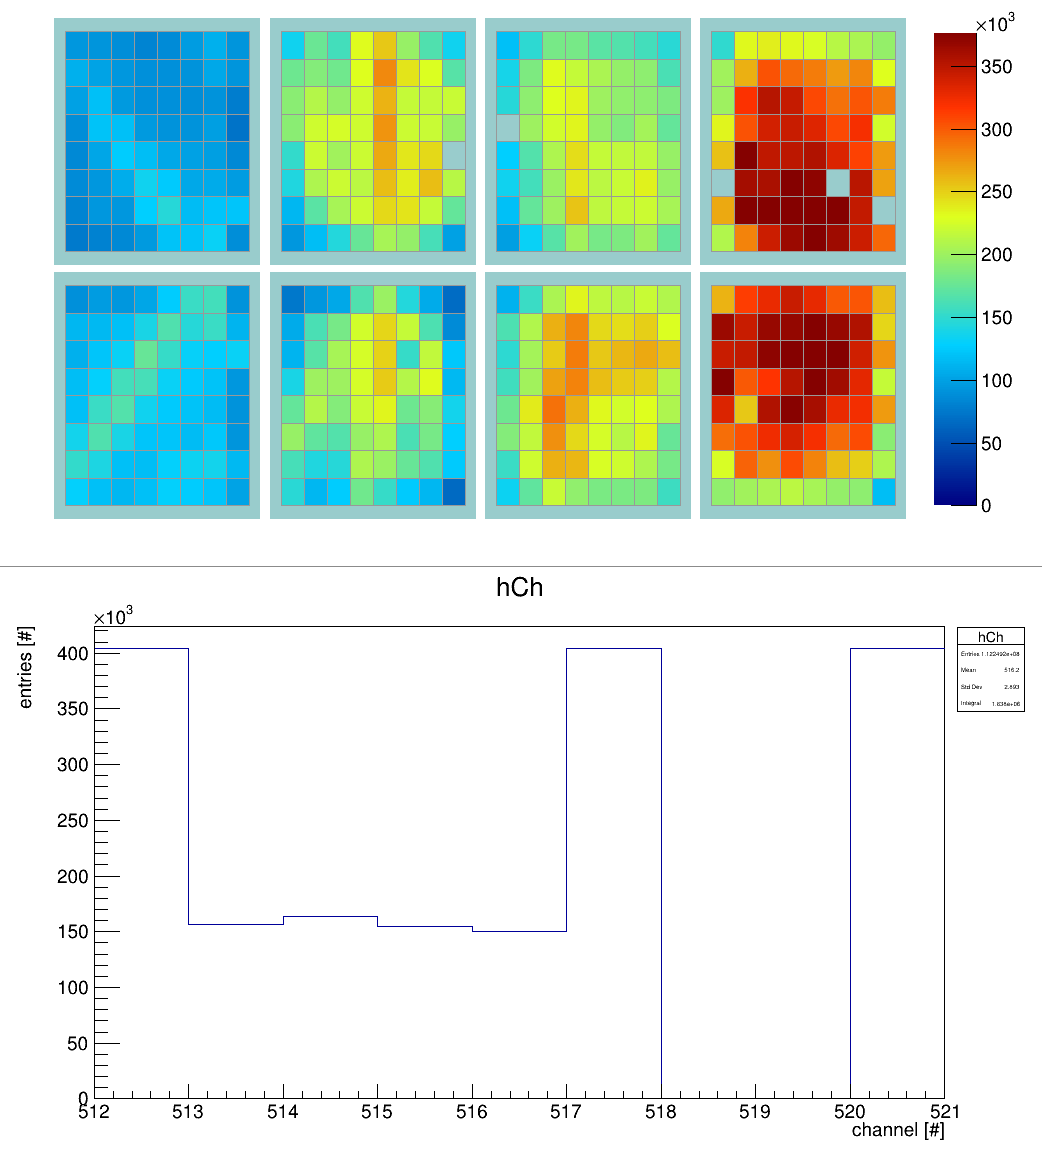
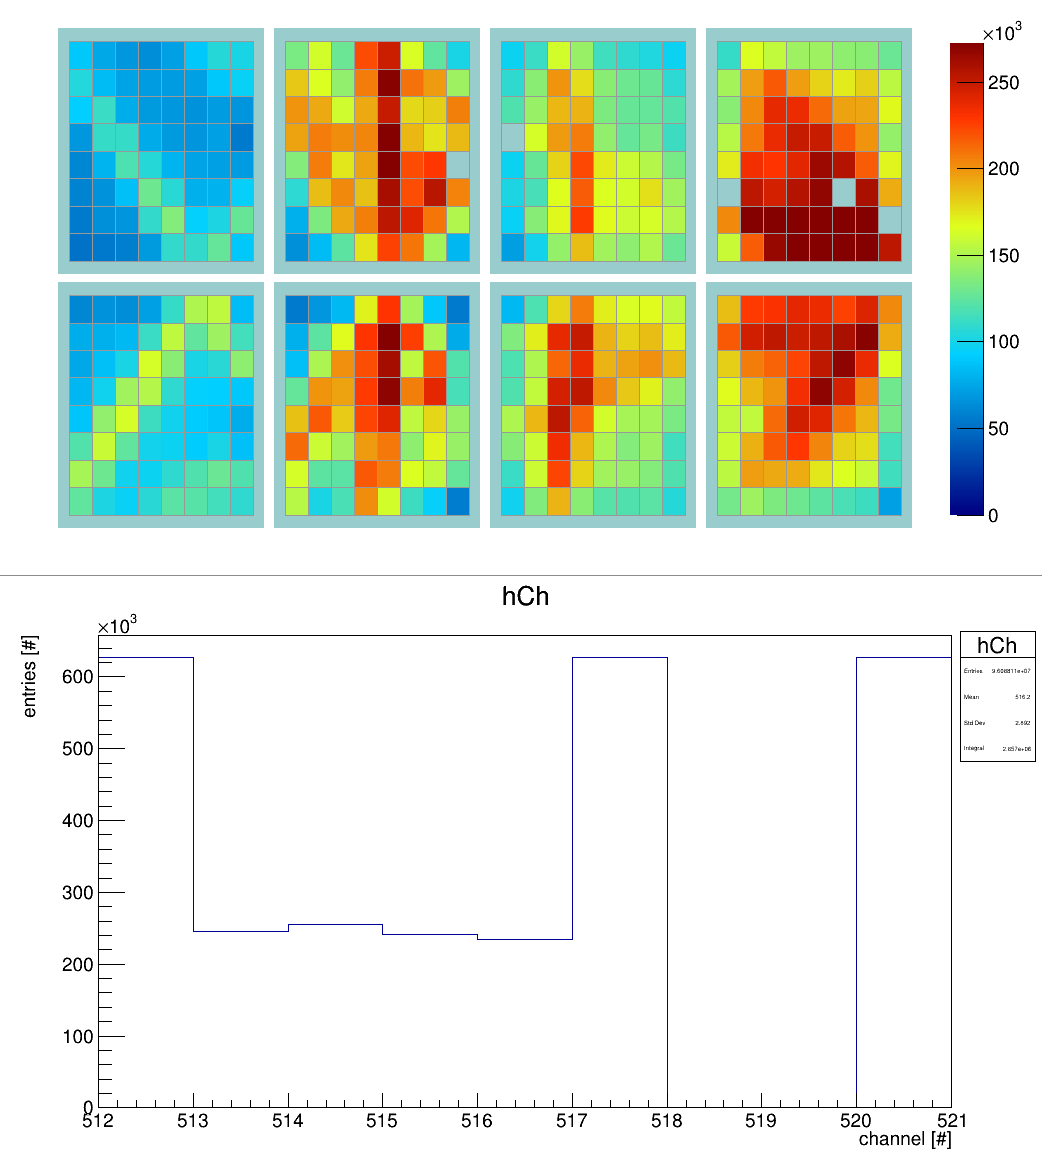
Hit patter and propagation time for configuration with (top) and without (bottom) calibration laser:
Hit multiplicity for beam + 1MHz laser in [-600,600] ns time window:
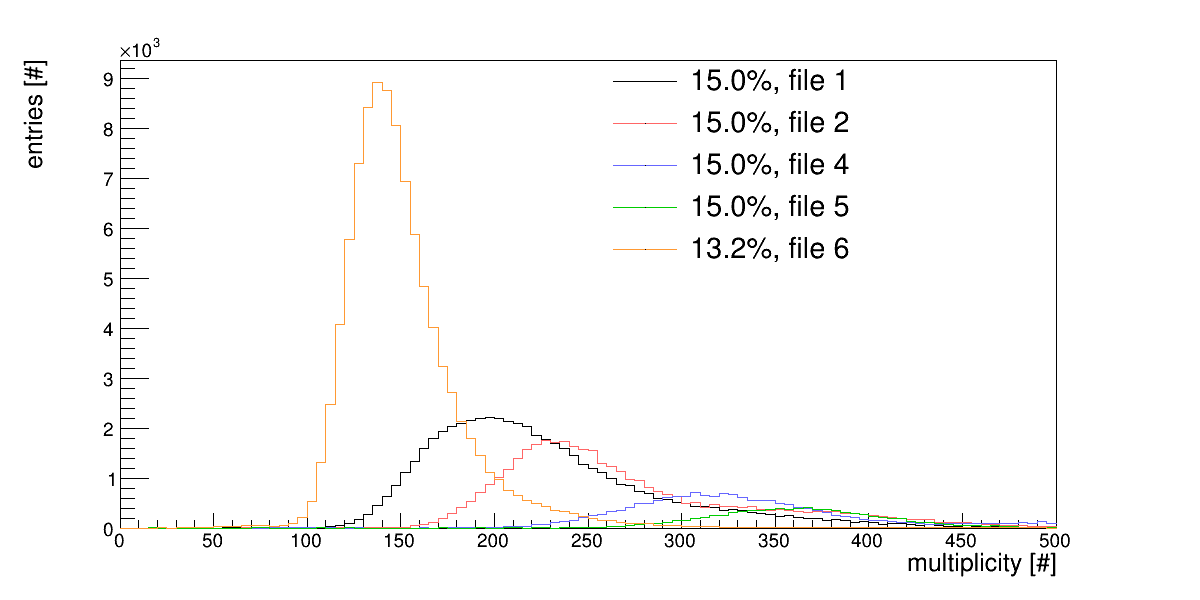
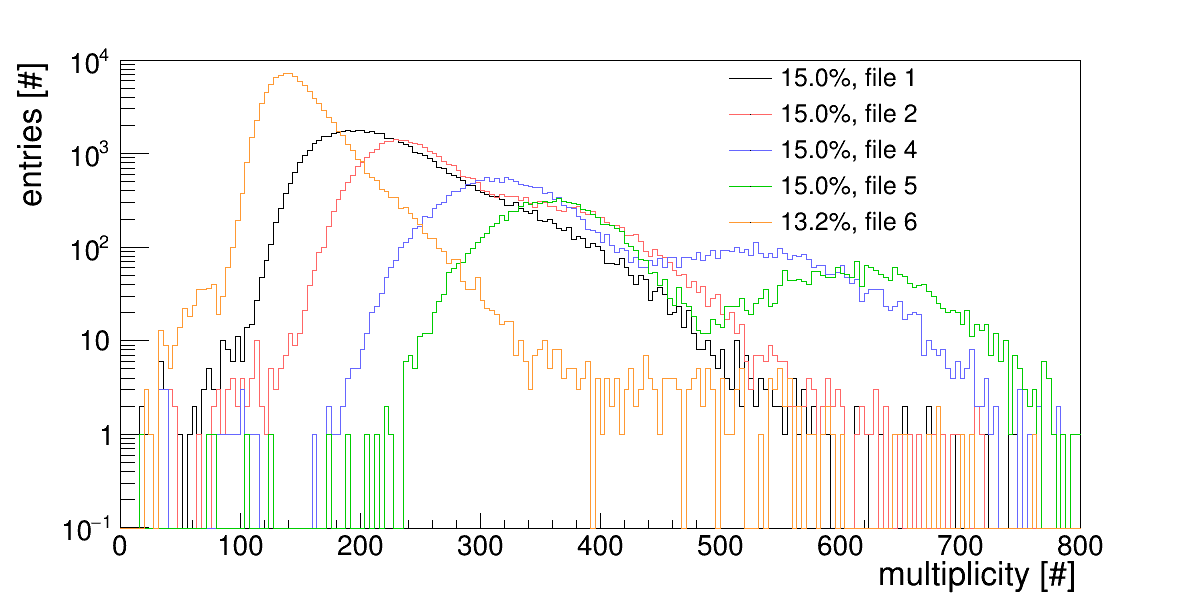
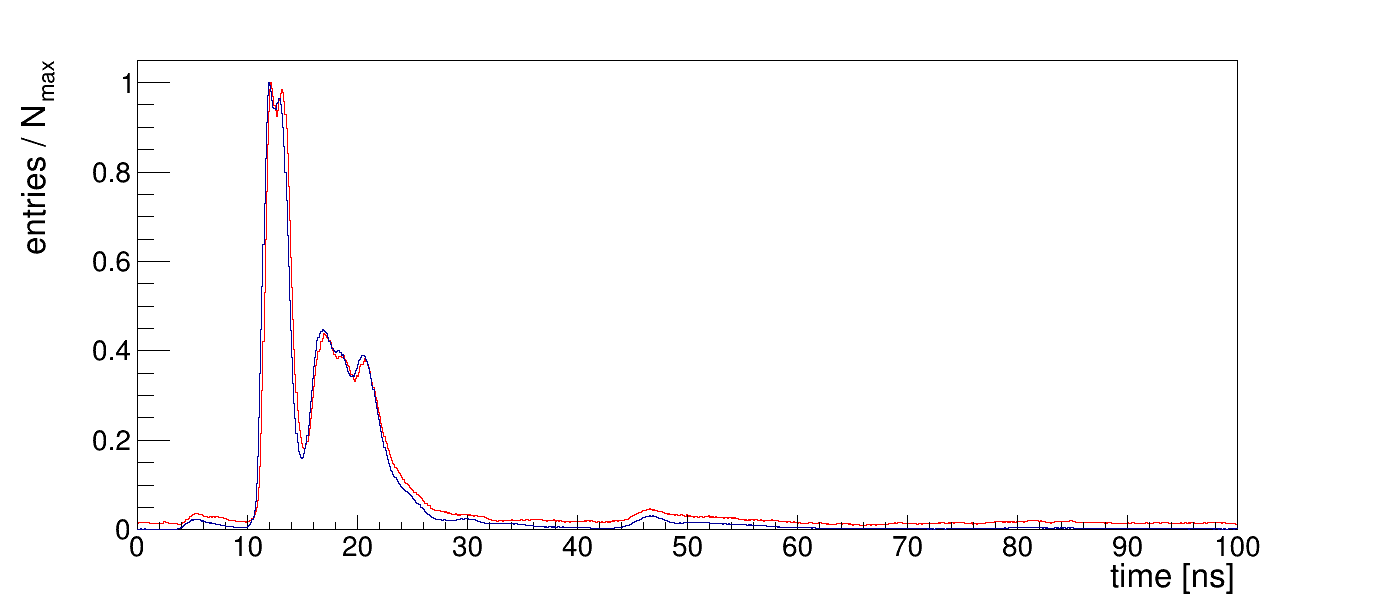
Hit multiplicity for [0,100] ns time cut:

Blue and red lines show propagation time without and with calibration laser, respectively.
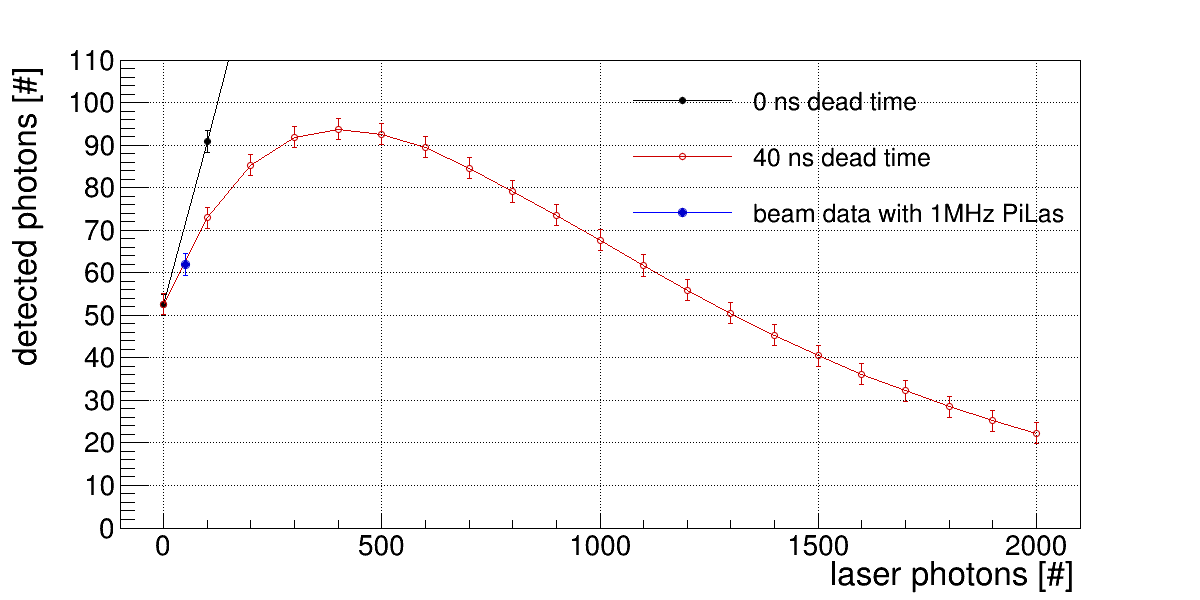
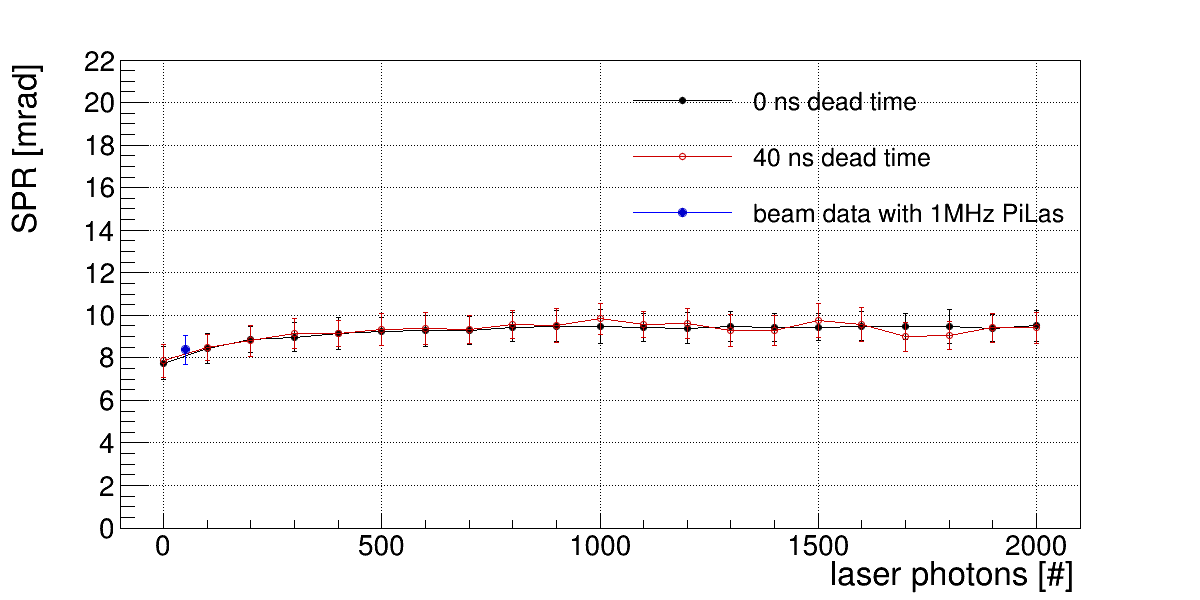
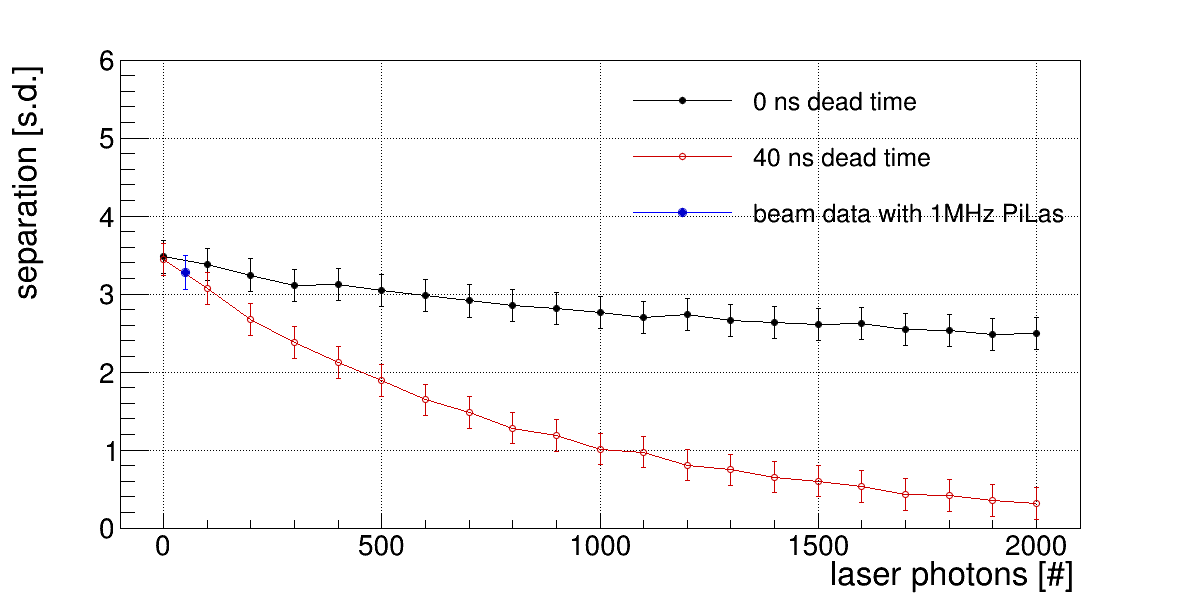
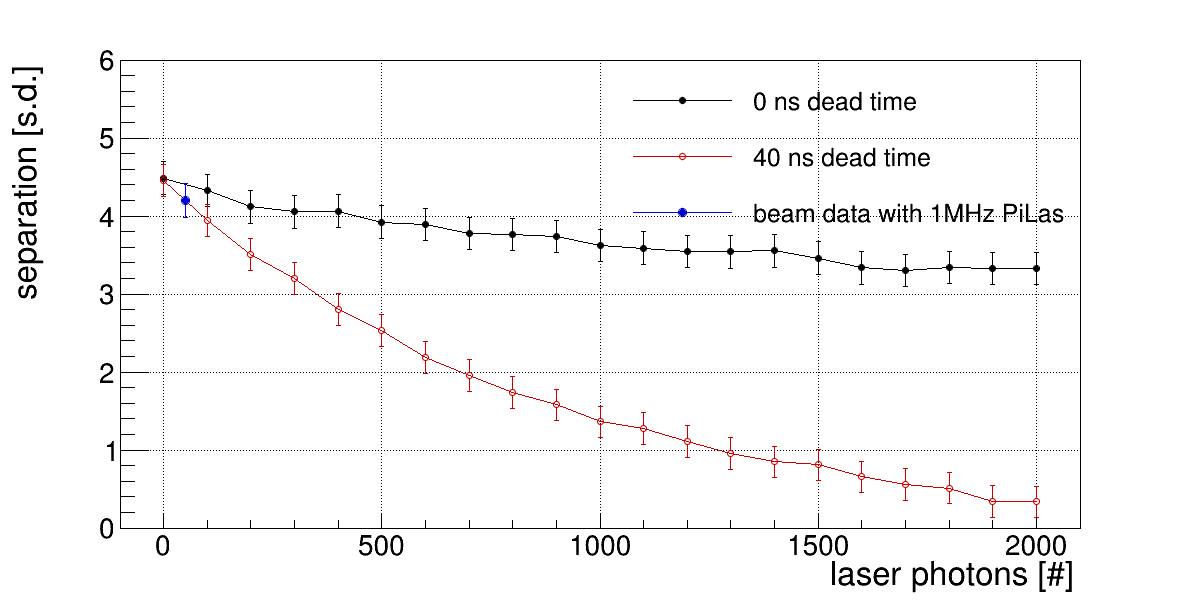
Beam data with calibration laser in comparison to simulation as the function of laser intensity. X axis shows laser intensity in 100 ns window.
Geometrical reconstruction:
Time imaging:
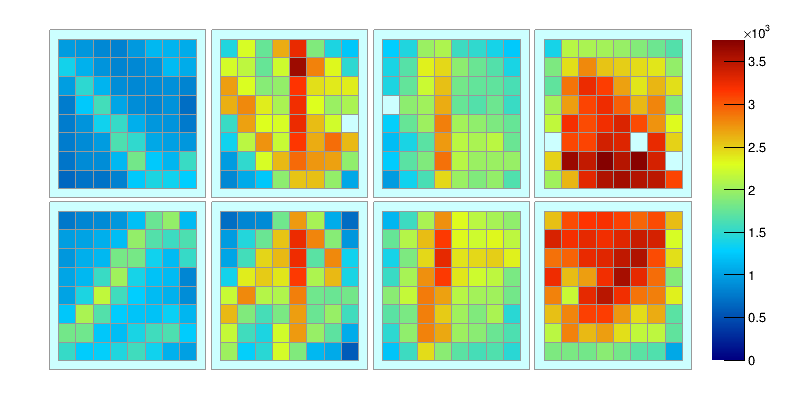
Trigger rates (GPIO 1 trigger 1 = ch 512; GPIO 2 trigger 2 = ch 513; GPIO6 Trigger box (LEVCON, NIM out) TRG cable from Trg1 (can be changed) or Laser cable (since 1.8.2018) = 517; GPIO 9 Trigger box (LEVCON, LVDS out) TRG cable from Trg1 (can be changed)) = ch 520. PiLas intensity 15.0% :
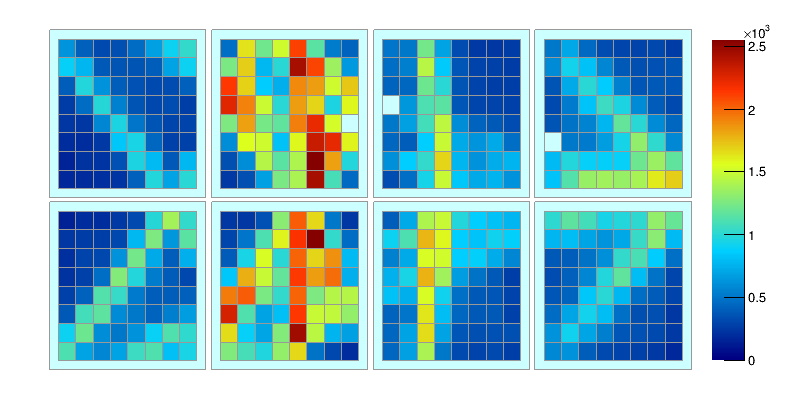
PiLas intensity 13.2% :
Update 20.06.24. Selecting hits in [-50,50] time window. Multiplicity of detected photons vs event number:

Accumulated multiplicity of all data in [-50,50] time window:


Reconstruction done using [-50,+50] slices in multiplicity after [-50,+50] time selection. "laser photons" shows the contribution of laser photons on top of Cherenkov photons from the event (50 photons @ 25 degree). Geometrical reconstruction:

Time imaging. PDFs obtained using all data:

Comparison to the simulations. Changes to previous analysis: [-25,+25] slices in multiplicity after [-50,+50] time selection; per-pmt correction done per data slice; 17 hodo fibers selection (for more stat); laser photons in the simulation is now distributed in [-50,50] window. Geometrical reconstruction:


Time imaging. PDFs obtained using all data:

Homogeneous laser vs 1 ns pulse (for simulated data). GR:


Time imaging:

Comparison of photon yield distributions in case of no dead time for homogeneous (top) and 1 ns pulse (bottom) lasers (250 laser photons):


Simulation with 40 ns dead time, 1 ns pulse and 250 laser photons:

Beam data with [200,300] laser photons slice:

=> the time window for simulation was [-50,50] and for the data selection [-100,100], simulation with [-100,100] time window:

Selection for final plots:
- [-50,50] ns time window for data and sim
- [-75,75] slices for beam data; this also used in simulation
- 40 ns dead time
- 1 ns spread of laser pulses
- 17 hodo fibers (vs. 8 used for run 403 ("golden"))
- same tof selection as for run 403
- 65 was used as a raw number of detected photons without laser pulses (to account for Cherenkov photons)


TI:


Compare different sampling range for the beam data. GR:


TI:

GR for [-25,25]:

TI for [-25,25]:

