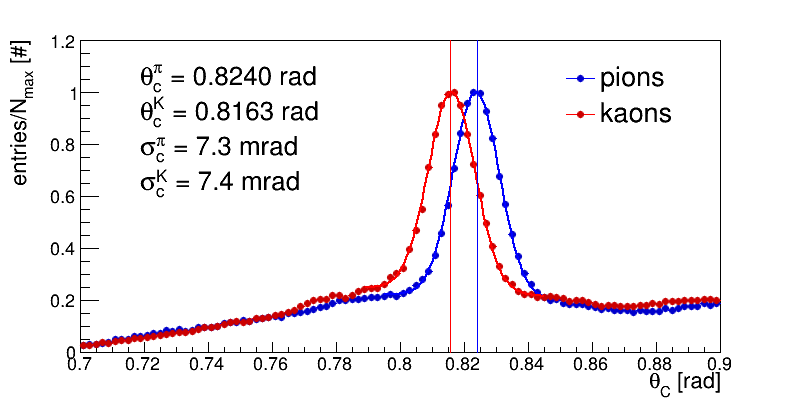
Comparison of the DIRC performance for positive and negative particles.
- geometrical reconstruction
- with per-pmt/chromatic corrections
- [3.4, 3.6] GeV/c pions and kaons from rho and phi events
- track selection: [31,35] bars (upper OB), [7,11] bars (lower OB); x from [-20,20] cm range
- calculated error of the separation power is +/- 0.1 s.d.
Upper OB:
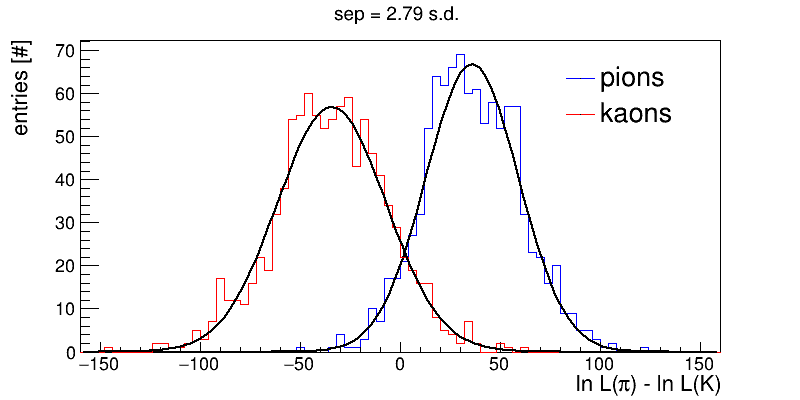
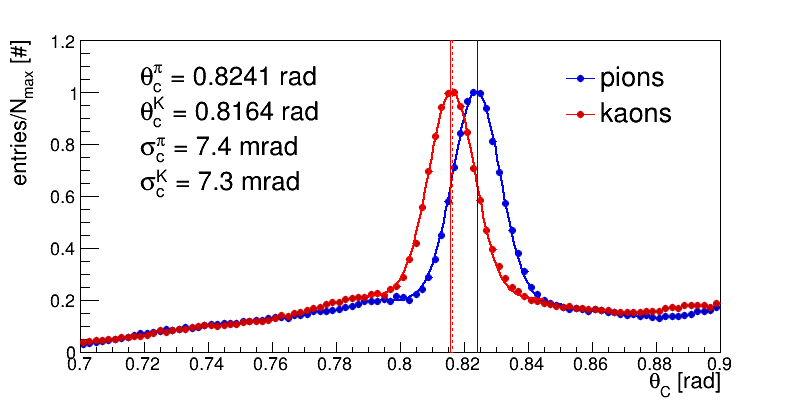
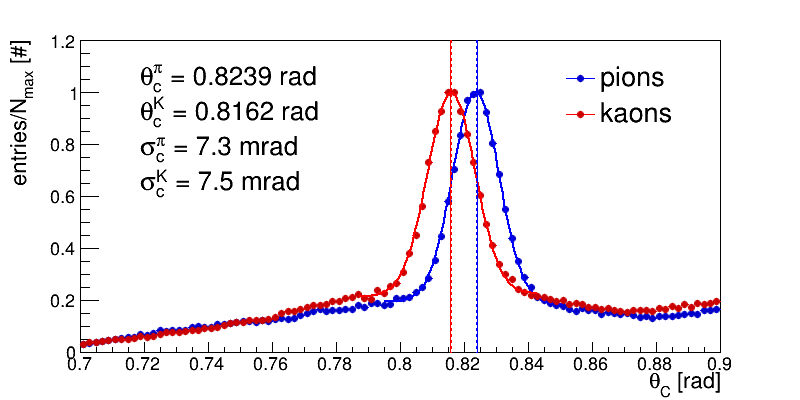
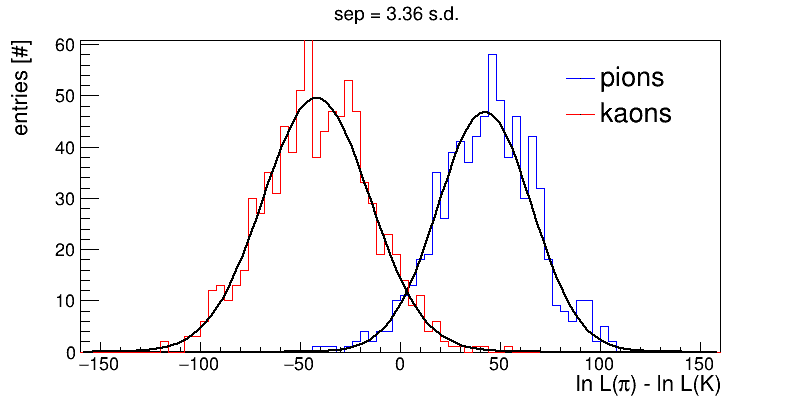
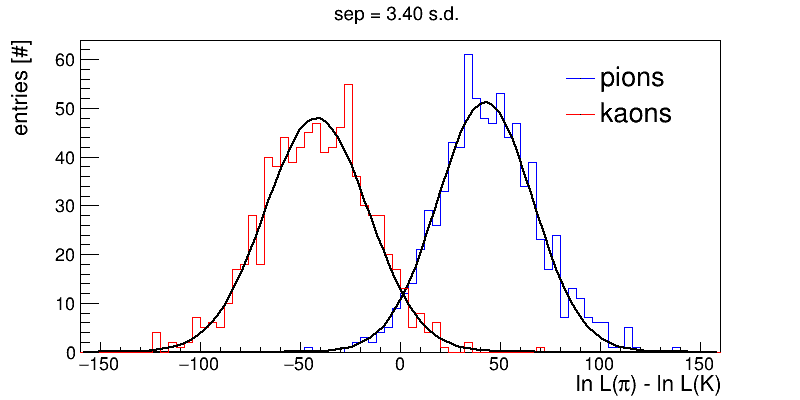
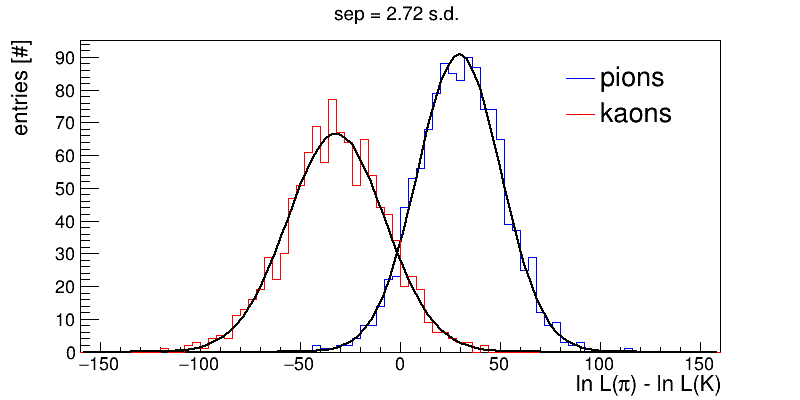
Separation power of geometrical reconstruction. Negative:
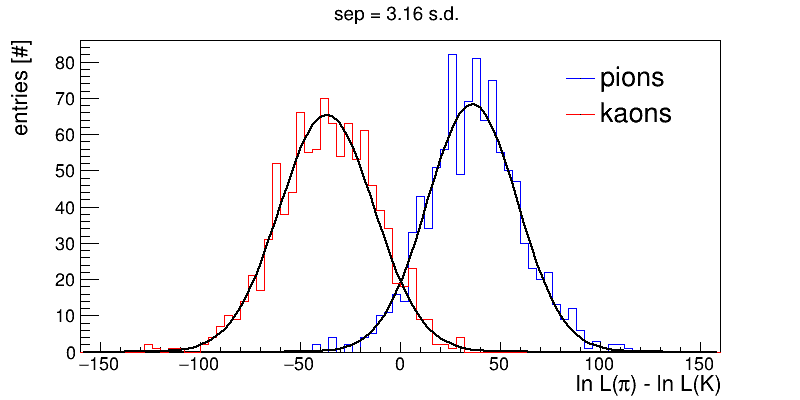
Positive:
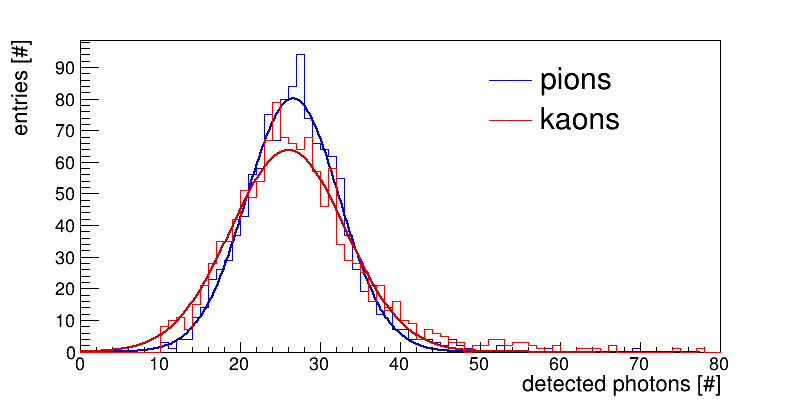
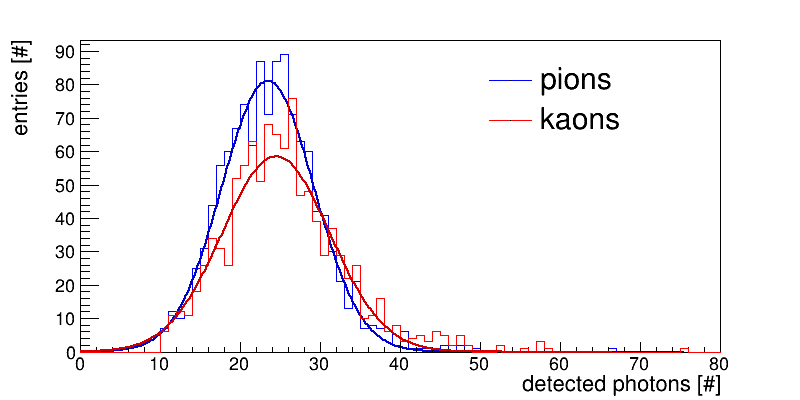
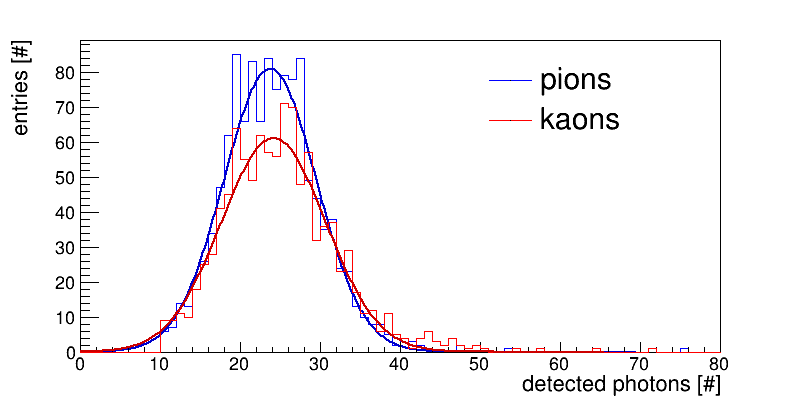
Photon yield comparison (27 vs 27): Negative
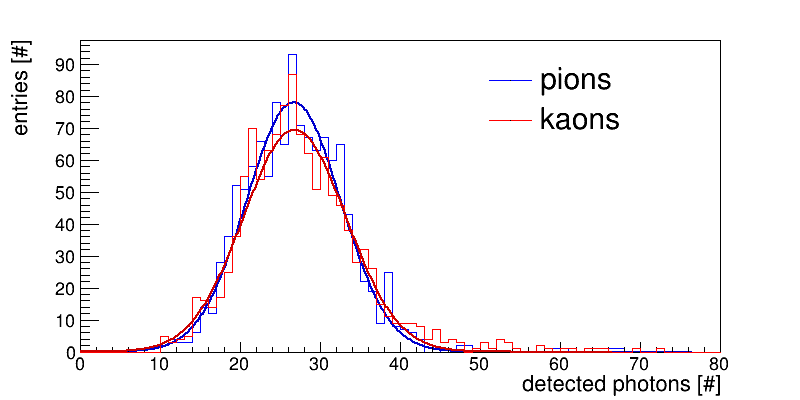
Positive:
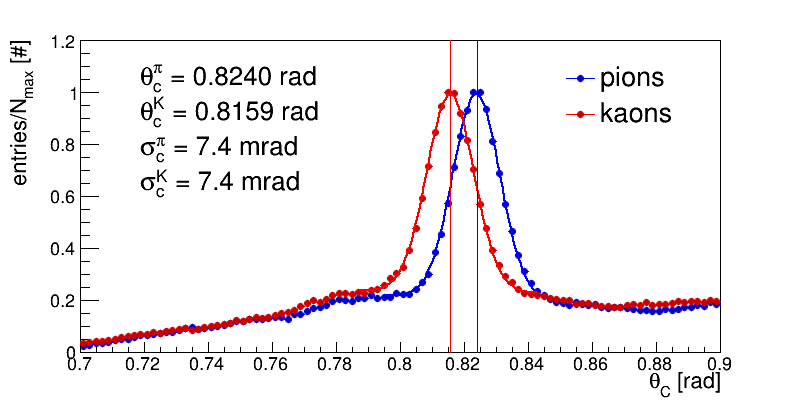
SPR. Negative:
Positive:
Simulation. Negative:
Positive:
Lower OB:
Separation power of geometrical reconstruction. Negative:
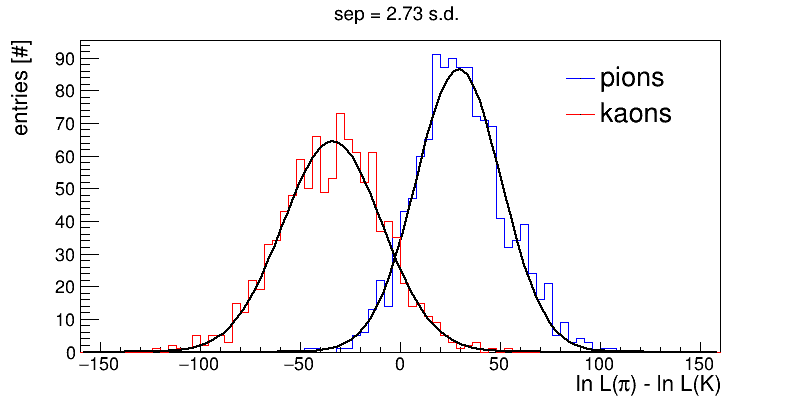
Positive:
Photon yield comparison (24 vs 24): Negative
Positive:
SPR: Negative
Positive:
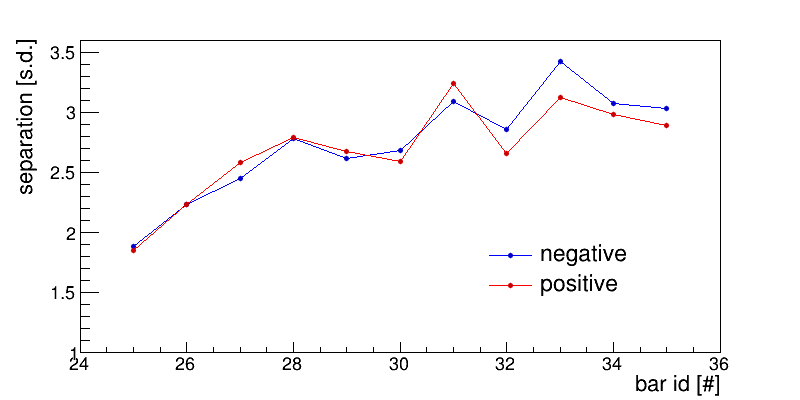
Separation vs bar number; p = 3.5 +/- 0.2 GeV/c :
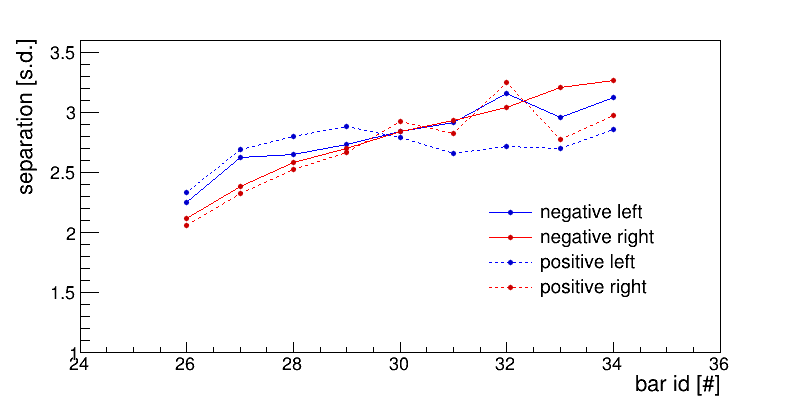
Separation vs bar number vs charge vs Left/Right tracks; statistics is sampled for every 3 bar; p = 3.5 +/- 0.2 GeV/c :
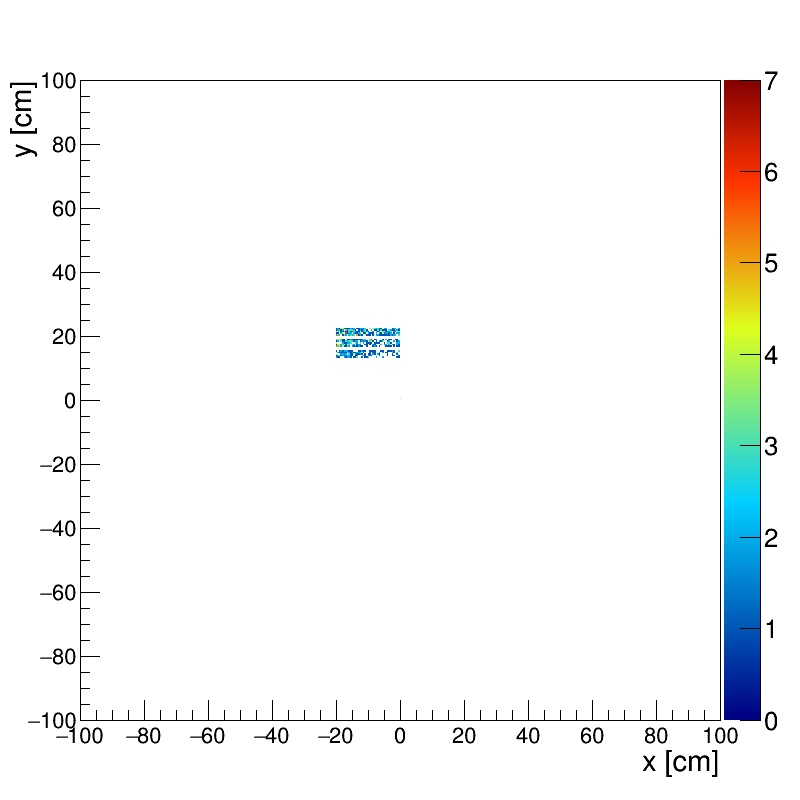
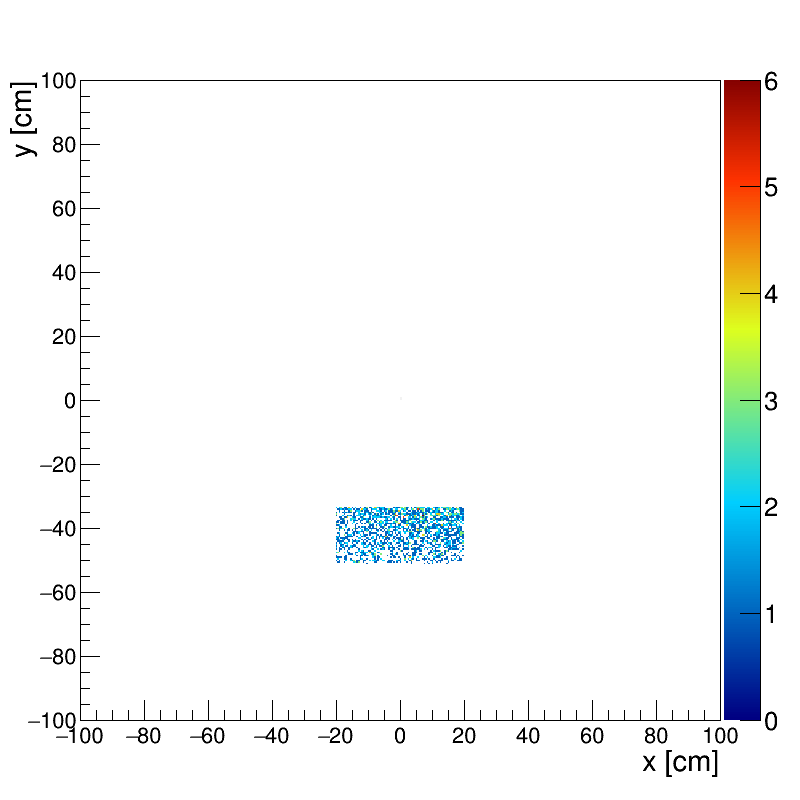
Example of charge particle hit distribution for bar 32 (31,32,33) right:
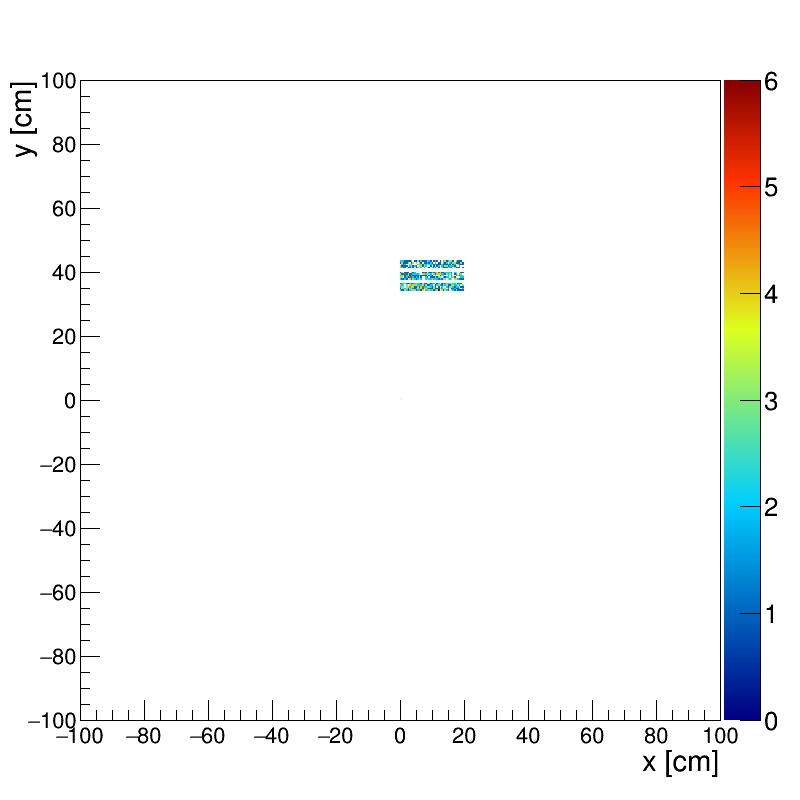
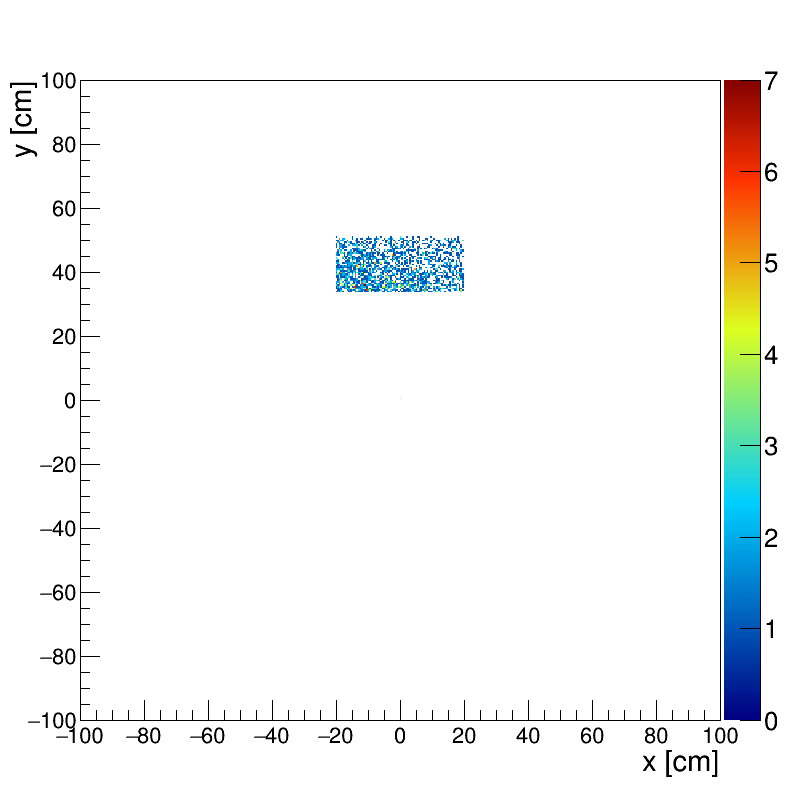
Example of charge particle hit distribution for bar 26 (25,26,27) left: