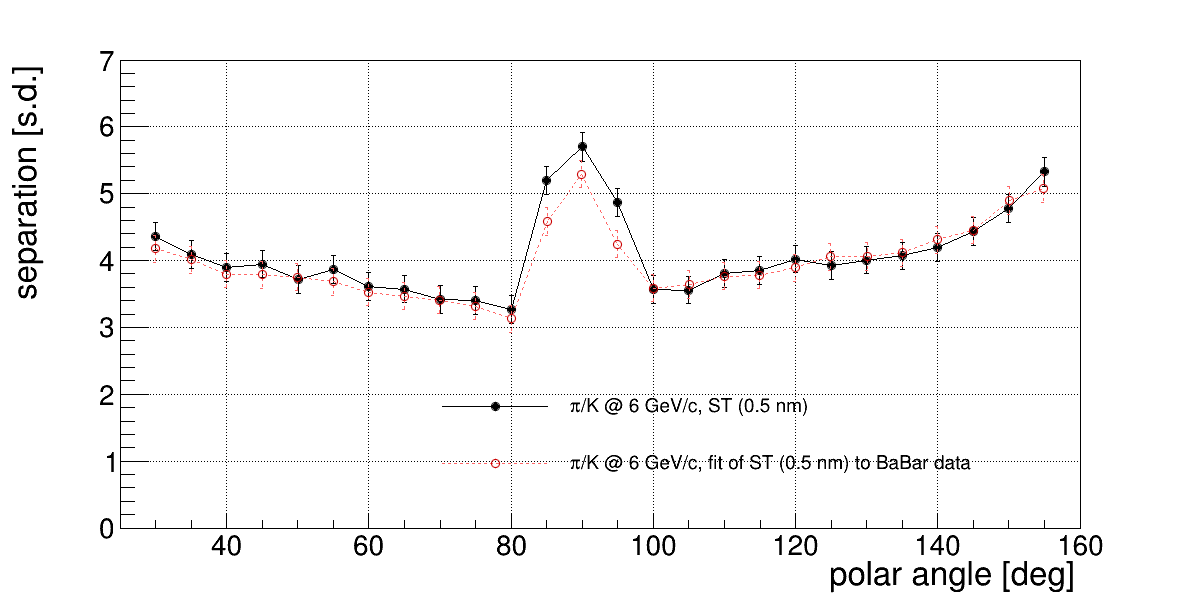
Comparison of transport efficiency based on scalar theory and fit to the data.
- DIRC@EIC, ePIC
- 3-layer spherical lens with sapphire, r=[62,36]
- 3 mm pixels HIQ400, CE=95%
- pi/K @ 6 GeV/c
- 0.5 mrad track smearing at tracking layer
- phi = 0 (no field); vertex y-shifted by 0.5*barwidth (to hit middle of the bar)
- 0.1 ns time precision
- geometrical reconstruction with averaged LUT from 15M photons
- GR with per-PMT and chromatic corrections
- 20k tracks for pdf generation (per each particle species) (generated with 0.5 mrad track resolution); 5k for determining separation
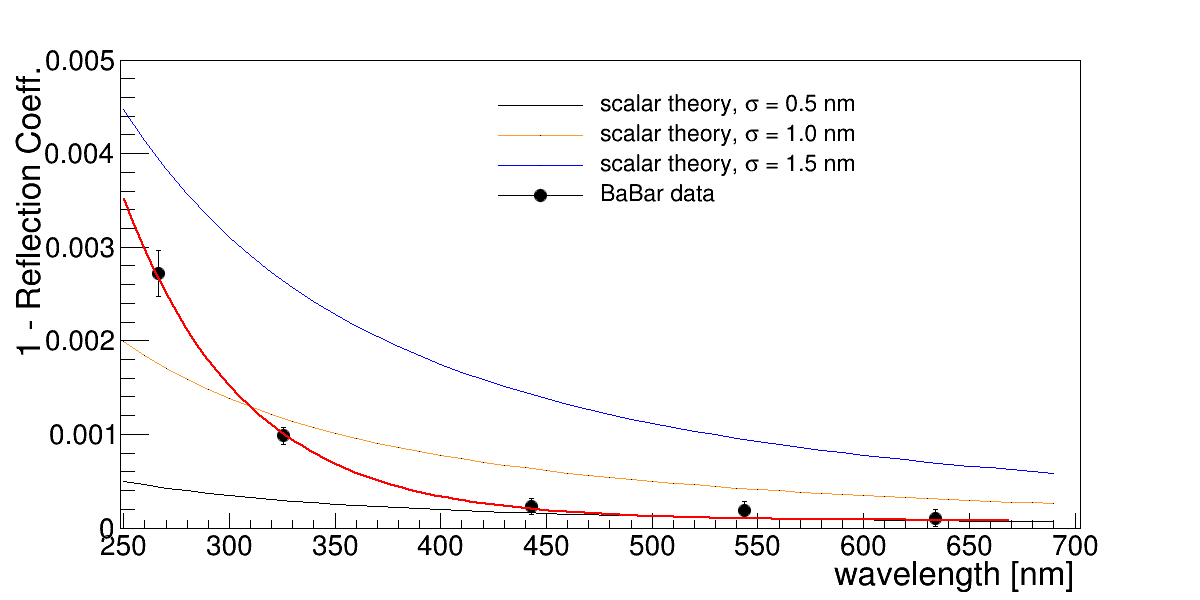
BaBar data in comparison to scalar theory with different roughness. All at Brewster angle. Data fitted with "expo + pol0" function.
Ratio of the fit to the BaBar data and ST with roughness 0.5 nm:
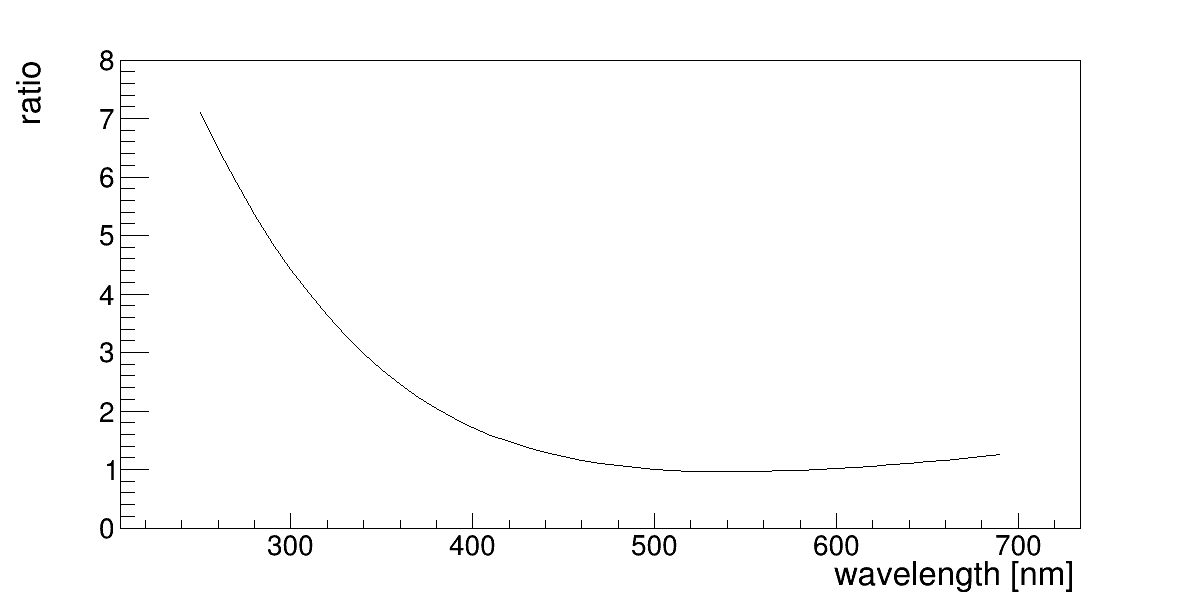
This ratio is applied to all reflection angles.
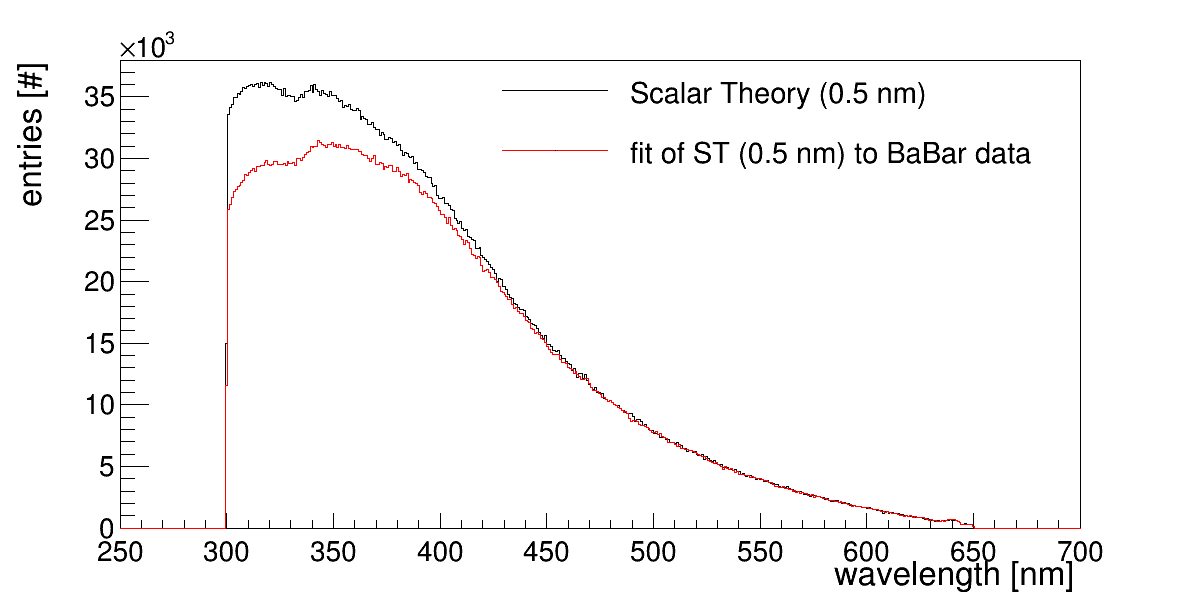
Wavelength distribution of detected Cherenkov photons (@ 30 deg polar angle of charge particle):
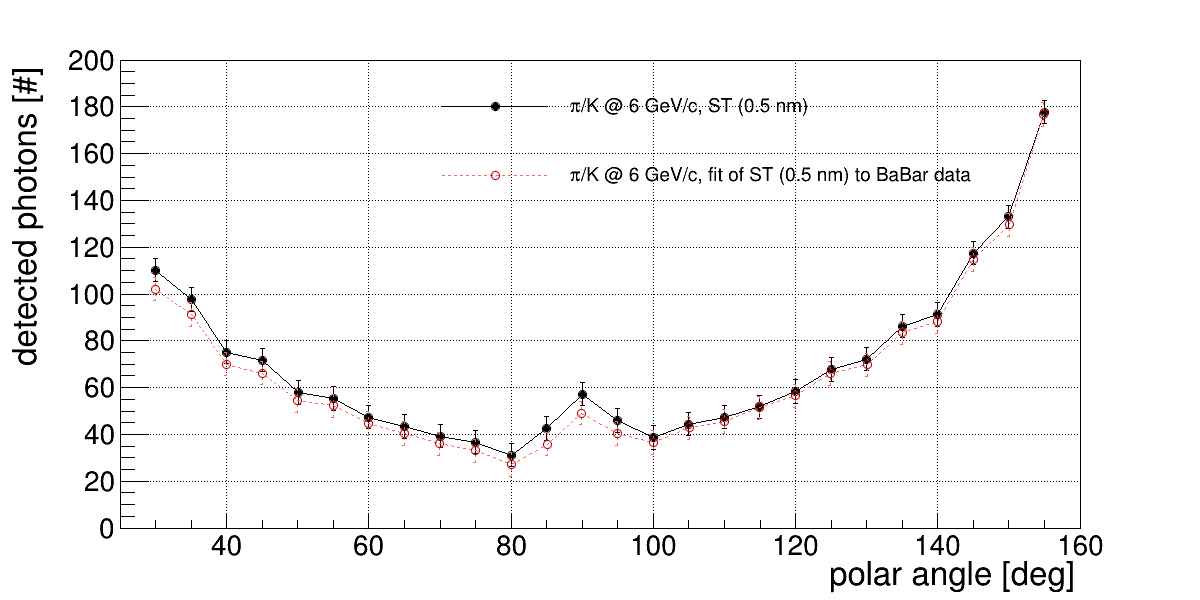
Performance plots. Photon yield after GR:
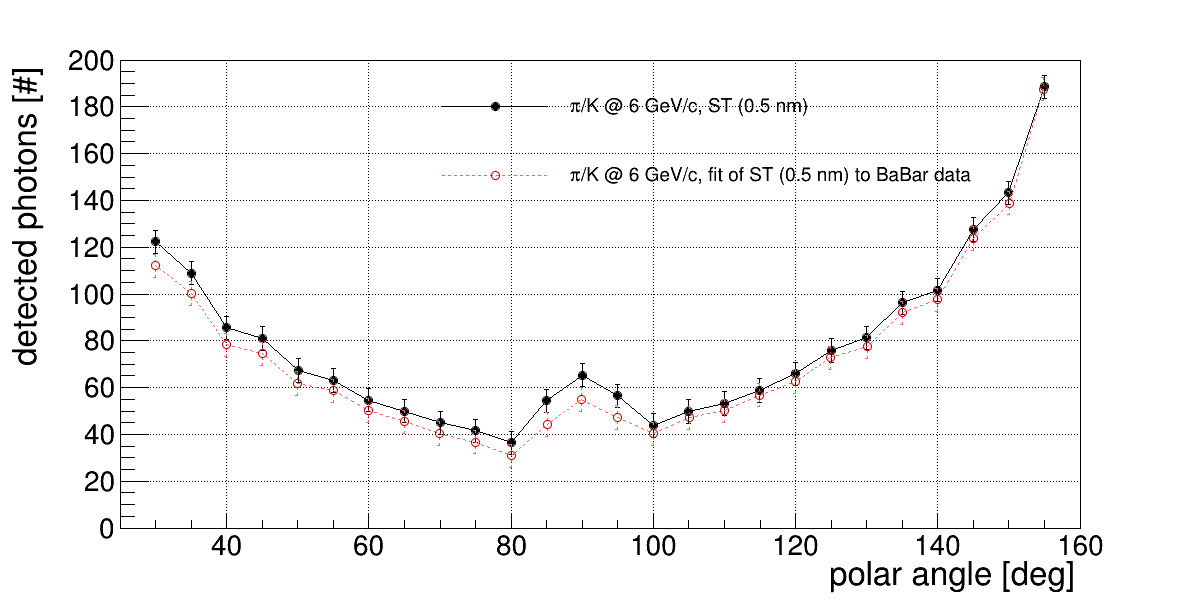
Photon yield after TI:
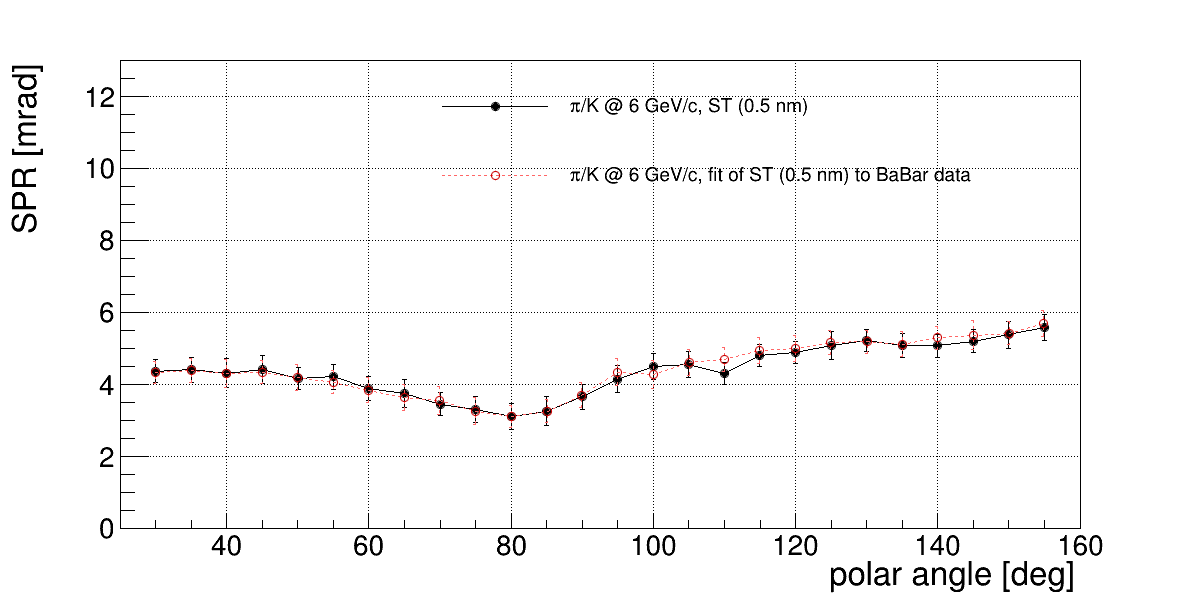
SPR:
GR:
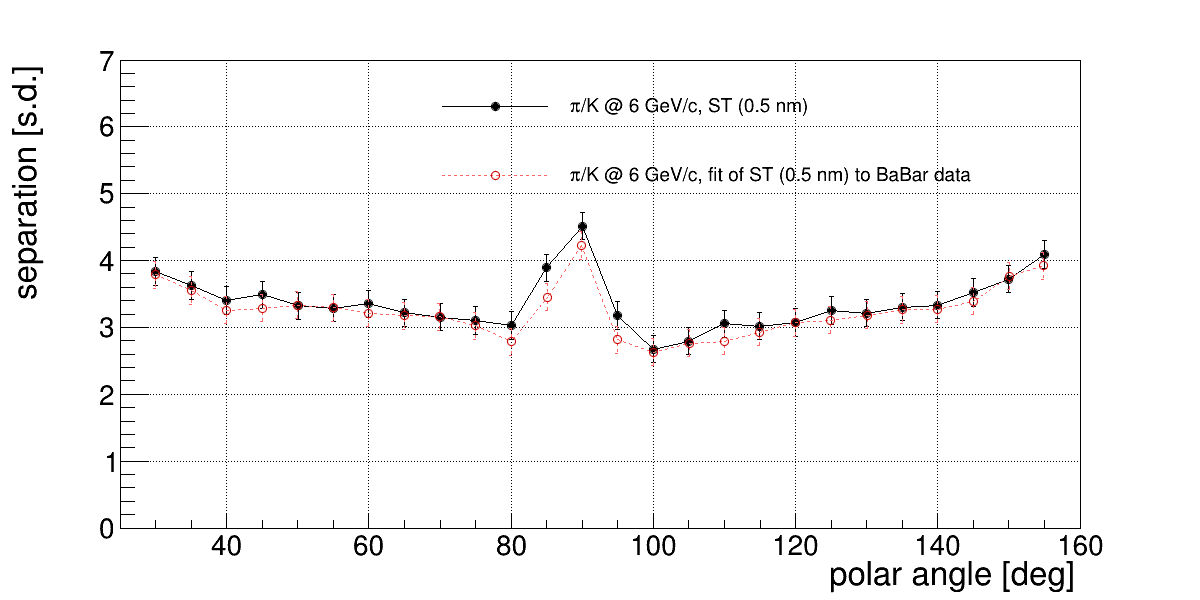
TI: