Selected results from CERN 2018 beam test.
- CERN 18
- geometrical and time imaging reconstruction
- delta t selection with s = 0.5 ns
- Cherenkov angle selection = 50 mrad
- with beam direction correction
- with per-PMT Cherenkov angle correction
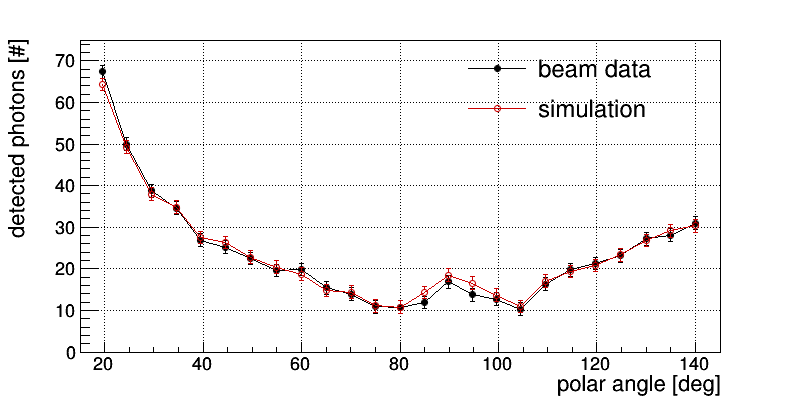
Polar angle scan @ 7 GeV/c. Photon yield from geometrical reconstruction:
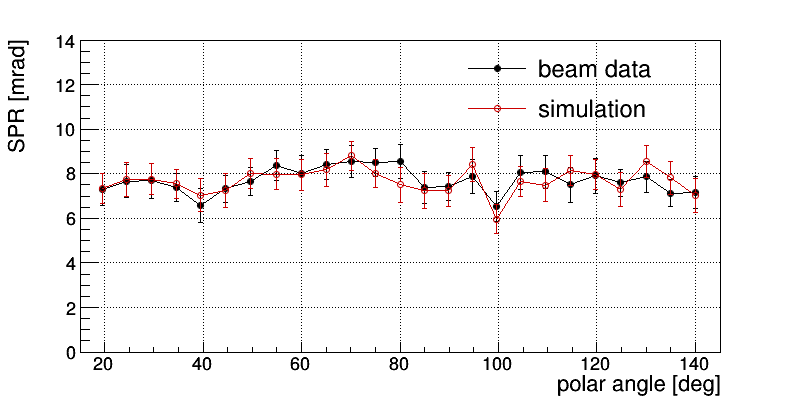
SPR for pions from geometrical reconstruction:
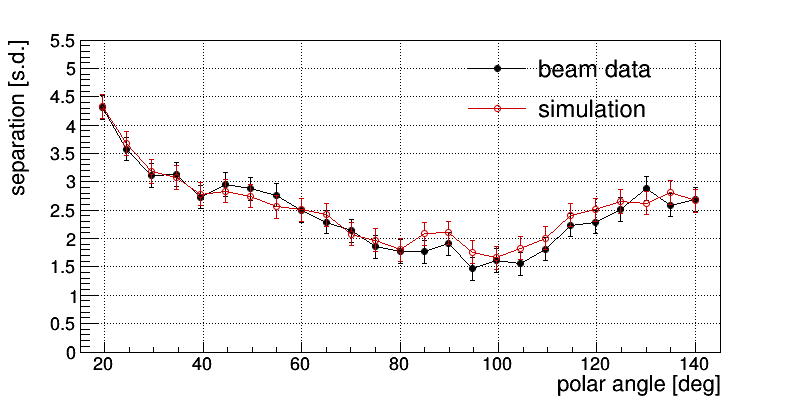
Separation power from geometrical reconstruction:
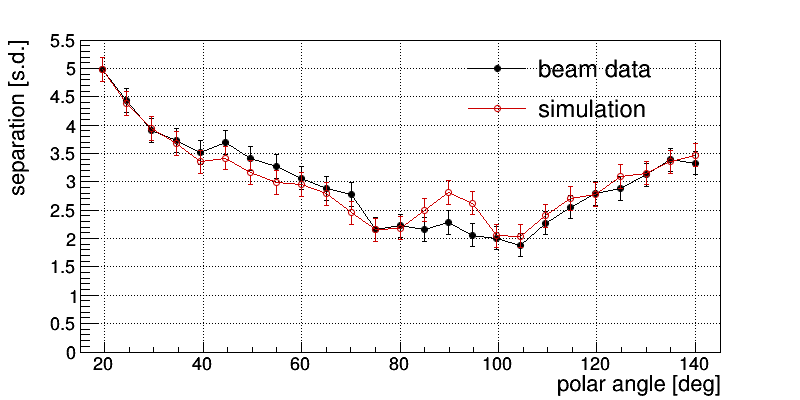
Separation power from time imaging:
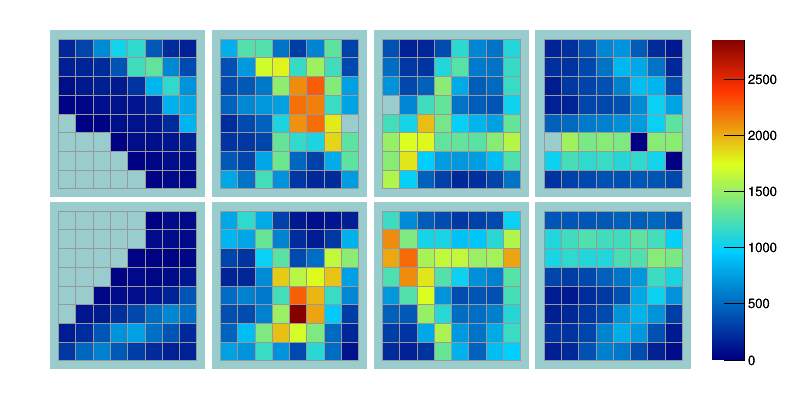
Hit pattern for 5000 pions @ 20 degree polar angle from geometrical reconstruction. Data:
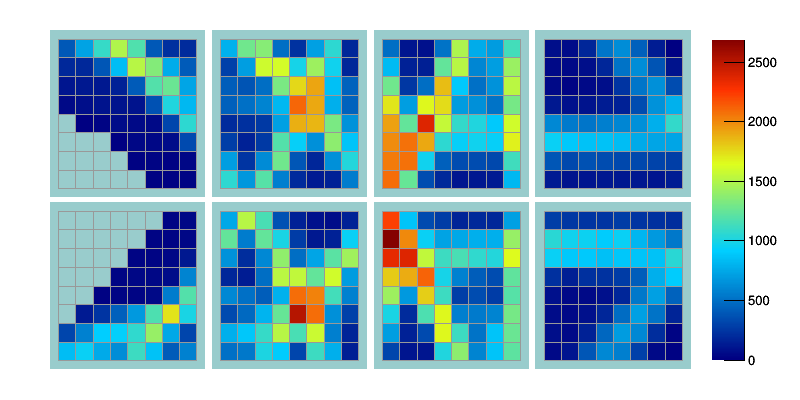
Simulation:
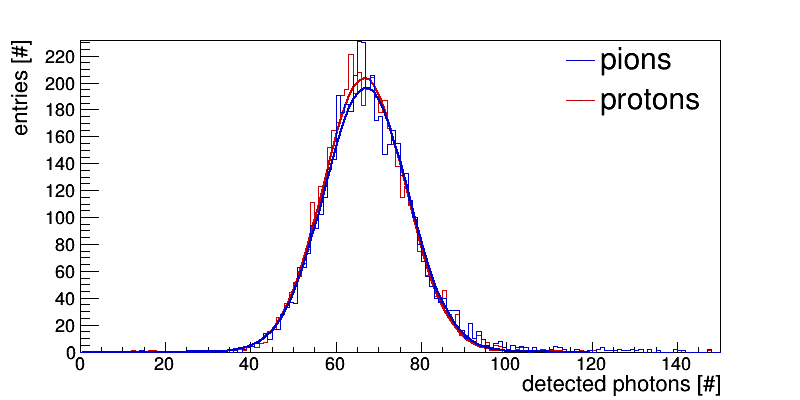
Photon yield @ 20 degree polar angle from geometrical reconstruction. Beam data. Mean of the Gaussian fit is 67 photons:
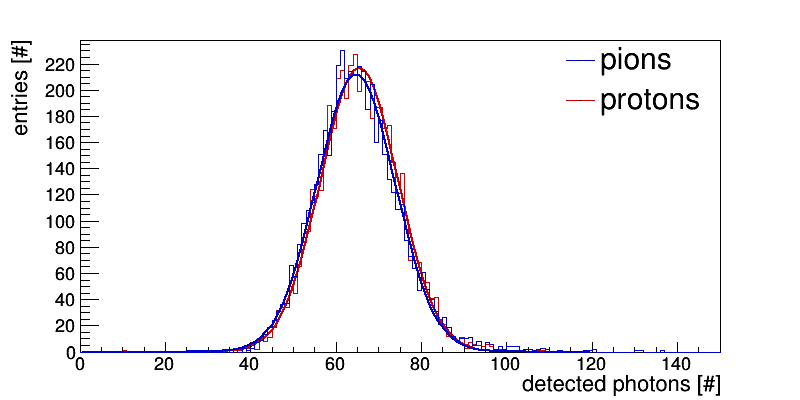
Simulation. Mean of the Gaussian fit is 65 photons:
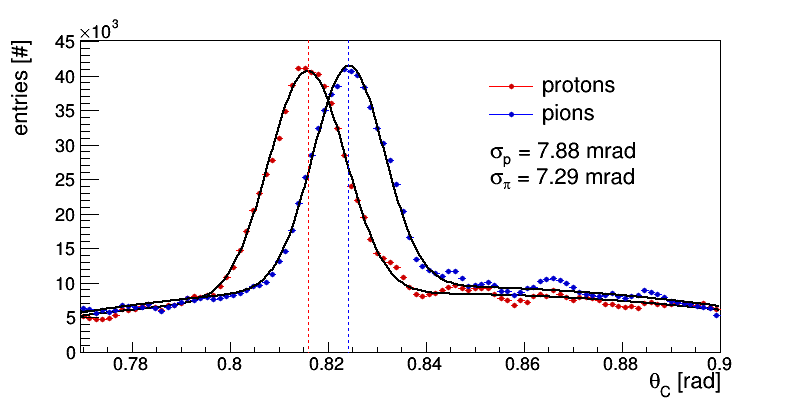
Reconstructed Cherenkov angle distribution for 5k pi and 5k protons @ 20 degree. Fit with Gaussian + 2nd order polynomial. Data:
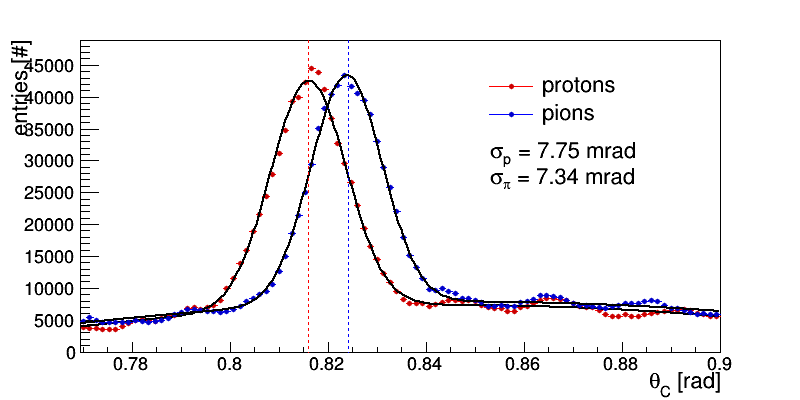
Simulation:
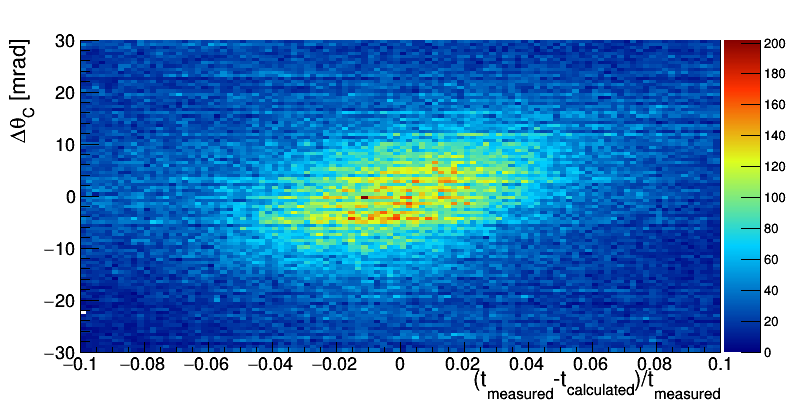
Chromatic correction plot for 5k pi and 5k protons @ 90 degree. Before:
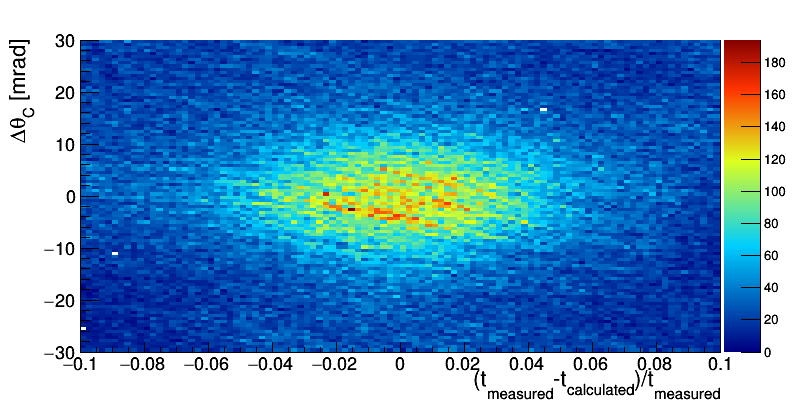
After:
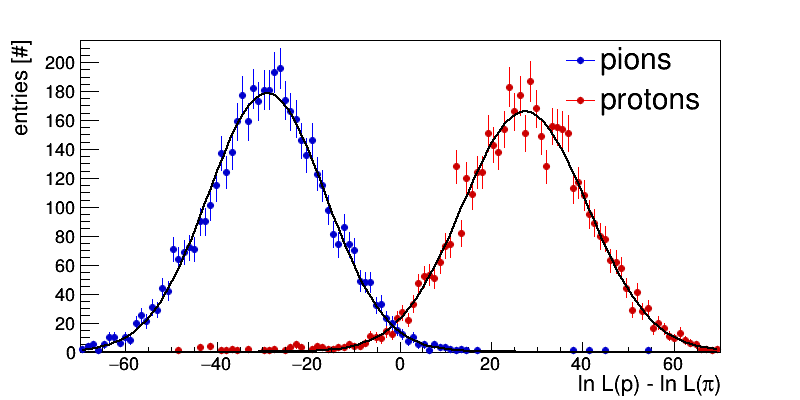
Likelihood distribution example @ 20 degree polar angle from geometrical reconstuction. 5000 pions and 5000 protons. Resulting separation power is 4.3 +/- 0.1:
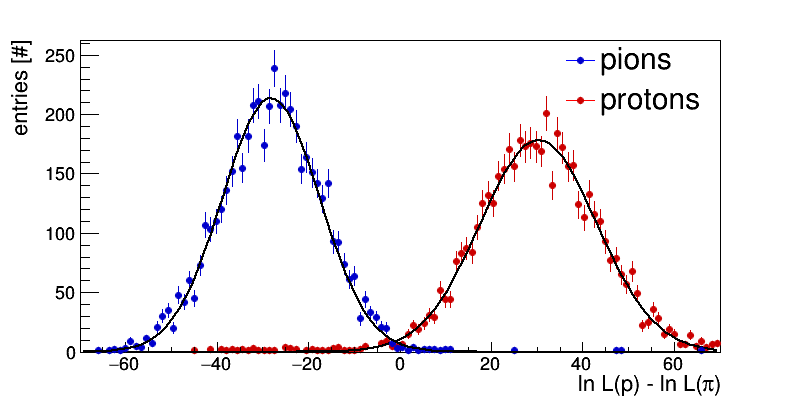
Likelihood distribution example @ 20 degree polar angle from time imaging. 5000 pions and 5000 protons. Resulting separation power is 5.0 +/- 0.1:
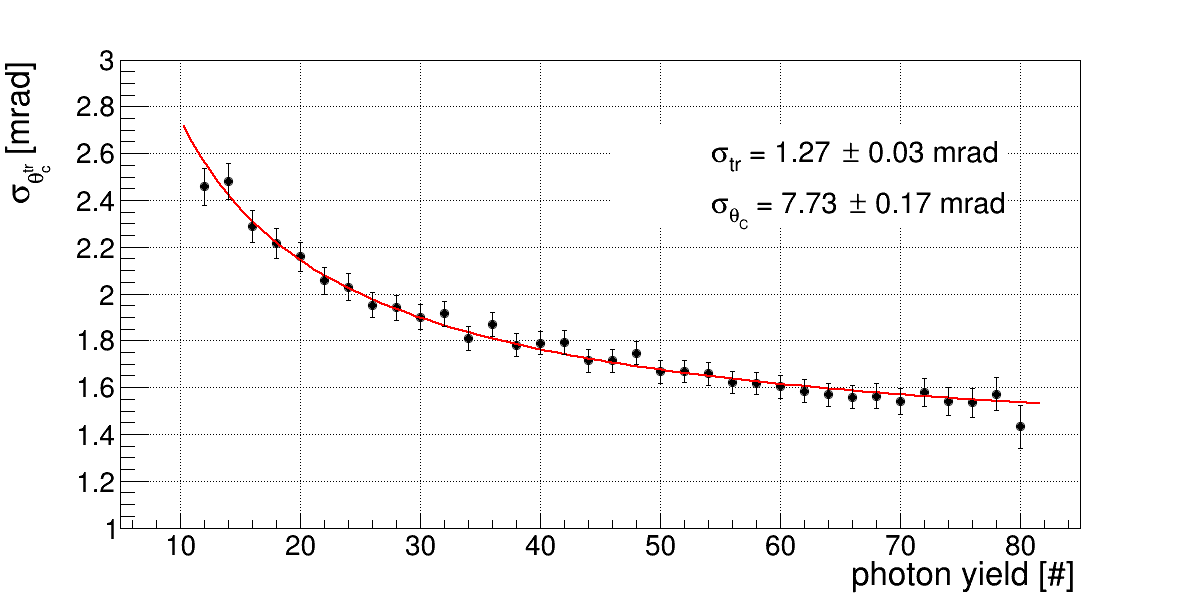
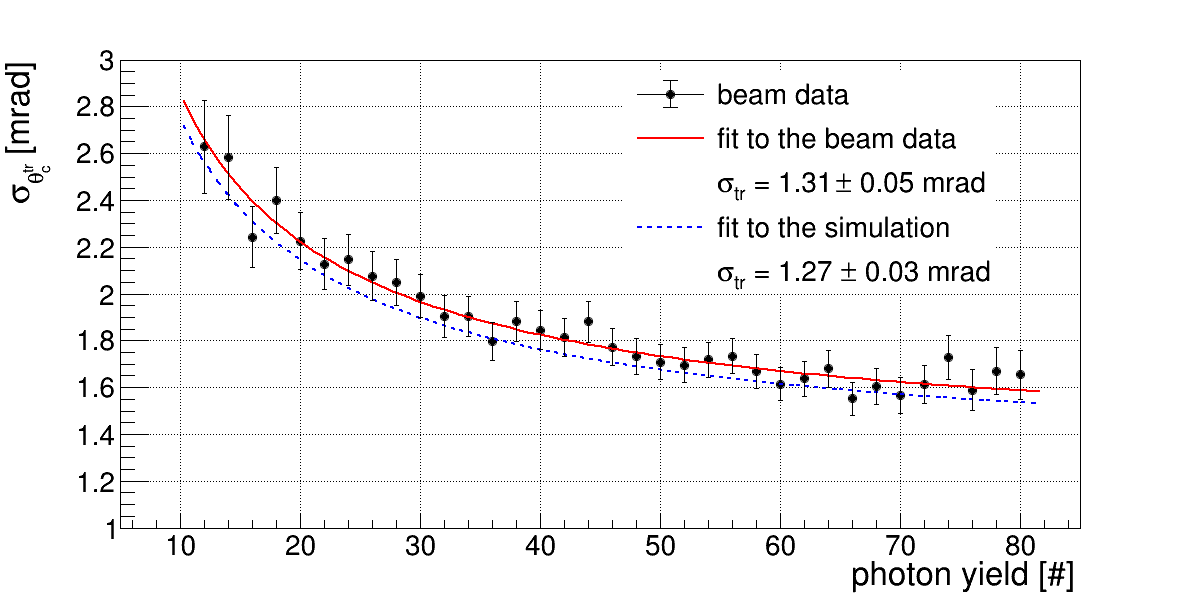
Cherenkov track resolution for pi/p at 7 GeV/c and 20 degree polar angle
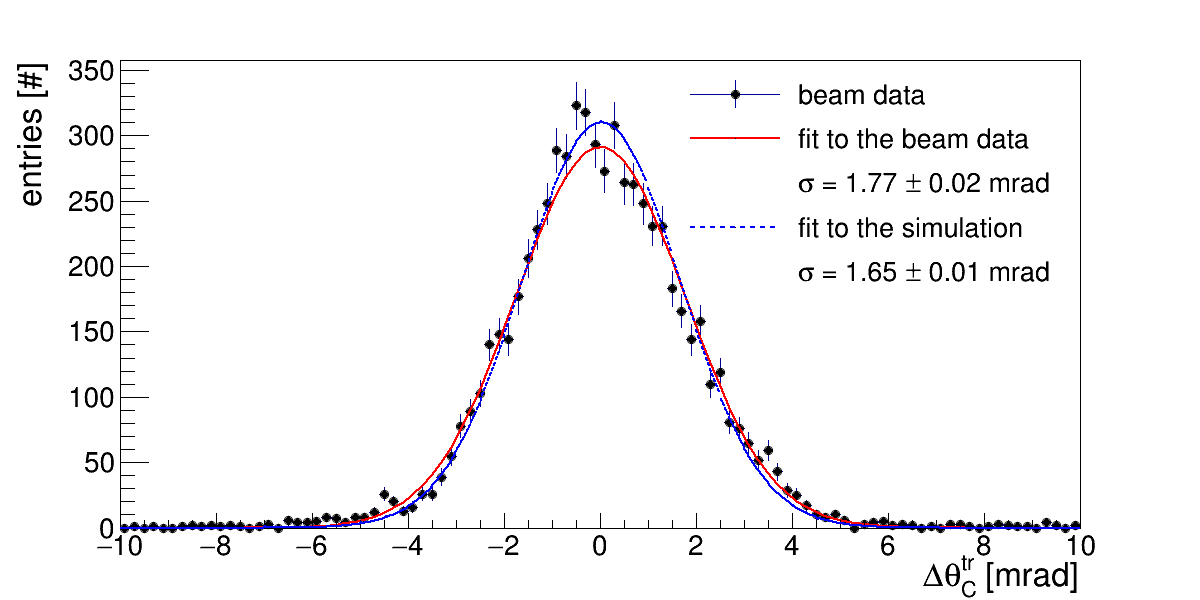
Cherenkov track resolution for beam data. 20 degree data sample reconstructed with different level of photons cutoff. 7 GeV/c pions only. Selection with 8 hodo-fibers. No-constrain fit:
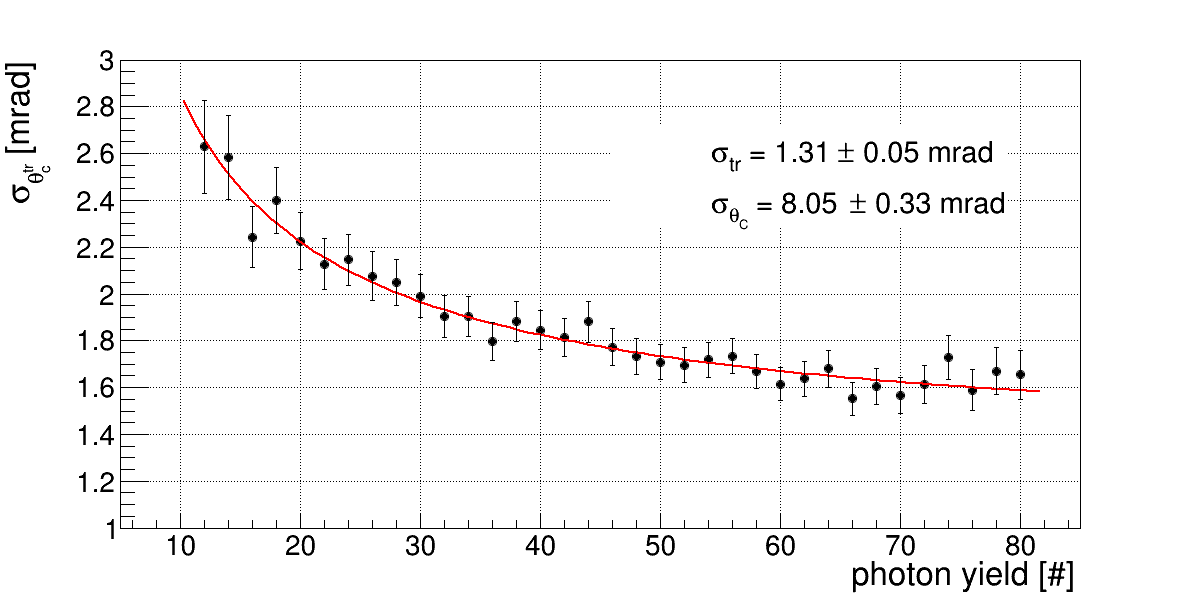
Simulation with 1.5 mrad beam divergence: